CCHS: Assessing data

Let us load all the necessary packages for data manipulation, statistical analysis, and plotting.

# Load required packages
library(survey)
library(knitr)
library(car)
library(tableone)
library(DataExplorer)

Load data

Data loading that we saved earlier:

load("Data/surveydata/cchs123.RData")
ls()
#> [1] "analytic"        "cc123a"          "has_annotations"

Checking

Check the data for missingness

Checks the dimensions of the data and runs functions to explore missing data, stratifying by some variables. Additionally, it plots the missing data for visualization.

dim(analytic)
#> [1] 397173     24
require("tableone")
#CreateTableOne(data = analytic, includeNA = TRUE)
CreateTableOne(data = analytic, strata = "CVD", includeNA = TRUE)
#>                       Stratified by CVD
#>                        event                 no event              p      test
#>   n                        25524                371121                        
#>   CVD (%)                                                             NaN     
#>      event                 25524 (100.0)             0 (  0.0)                
#>      no event                  0 (  0.0)        371121 (100.0)                
#>      NA                        0 (  0.0)             0 (  0.0)                
#>   age (%)                                                          <0.001     
#>      20-29 years             330 (  1.3)         48293 ( 13.0)                
#>      30-39 years             580 (  2.3)         63194 ( 17.0)                
#>      40-49 years            1498 (  5.9)         63549 ( 17.1)                
#>      50-59 years            3635 ( 14.2)         57300 ( 15.4)                
#>      60-64 years            2720 ( 10.7)         22497 (  6.1)                
#>      65 years and over     16496 ( 64.6)         64198 ( 17.3)                
#>      teen                    265 (  1.0)         52090 ( 14.0)                
#>   sex = Male (%)           12506 ( 49.0)        169776 ( 45.7)     <0.001     
#>   married (%)                                                      <0.001     
#>      not single            13287 ( 52.1)        188687 ( 50.8)                
#>      single                12207 ( 47.8)        181811 ( 49.0)                
#>      NA                       30 (  0.1)           623 (  0.2)                
#>   race (%)                                                         <0.001     
#>      Non-white              1276 (  5.0)         37323 ( 10.1)                
#>      White                 23629 ( 92.6)        325178 ( 87.6)                
#>      NA                      619 (  2.4)          8620 (  2.3)                
#>   edu (%)                                                          <0.001     
#>      < 2ndary              11547 ( 45.2)        112678 ( 30.4)                
#>      2nd grad.              3310 ( 13.0)         61355 ( 16.5)                
#>      Other 2nd grad.        1323 (  5.2)         27643 (  7.4)                
#>      Post-2nd grad.         8744 ( 34.3)        163052 ( 43.9)                
#>      NA                      600 (  2.4)          6393 (  1.7)                
#>   income (%)                                                       <0.001     
#>      $29,999 or less       11664 ( 45.7)         89506 ( 24.1)                
#>      $30,000-$49,999        4871 ( 19.1)         72994 ( 19.7)                
#>      $50,000-$79,999        3193 ( 12.5)         81861 ( 22.1)                
#>      $80,000 or more        1905 (  7.5)         73768 ( 19.9)                
#>      NA                     3891 ( 15.2)         52992 ( 14.3)                
#>   bmi (%)                                                          <0.001     
#>      Underweight             504 (  2.0)          9600 (  2.6)                
#>      healthy weight         7176 ( 28.1)        141200 ( 38.0)                
#>      Overweight            12104 ( 47.4)        153887 ( 41.5)                
#>      NA                     5740 ( 22.5)         66434 ( 17.9)                
#>   phyact (%)                                                       <0.001     
#>      Active                 3642 ( 14.3)         94844 ( 25.6)                
#>      Inactive              15494 ( 60.7)        174976 ( 47.1)                
#>      Moderate               4928 ( 19.3)         88480 ( 23.8)                
#>      NA                     1460 (  5.7)         12821 (  3.5)                
#>   doctor (%)                                                       <0.001     
#>      No                     1134 (  4.4)         57425 ( 15.5)                
#>      Yes                   24384 ( 95.5)        313282 ( 84.4)                
#>      NA                        6 (  0.0)           414 (  0.1)                
#>   stress (%)                                                       <0.001     
#>      Not too stressed      20041 ( 78.5)        266358 ( 71.8)                
#>      stressed               5184 ( 20.3)         76986 ( 20.7)                
#>      NA                      299 (  1.2)         27777 (  7.5)                
#>   smoke (%)                                                        <0.001     
#>      Current smoker         4481 ( 17.6)         93253 ( 25.1)                
#>      Former smoker         13927 ( 54.6)        143421 ( 38.6)                
#>      Never smoker           6981 ( 27.4)        132891 ( 35.8)                
#>      NA                      135 (  0.5)          1556 (  0.4)                
#>   drink (%)                                                        <0.001     
#>      Current drinker       15852 ( 62.1)        279583 ( 75.3)                
#>      Former driker          6820 ( 26.7)         48373 ( 13.0)                
#>      Never drank            2421 (  9.5)         38195 ( 10.3)                
#>      NA                      431 (  1.7)          4970 (  1.3)                
#>   fruit (%)                                                        <0.001     
#>      0-3 daily serving      4284 ( 16.8)         79088 ( 21.3)                
#>      4-6 daily serving     10527 ( 41.2)        148684 ( 40.1)                
#>      6+ daily serving       5047 ( 19.8)         73729 ( 19.9)                
#>      NA                     5666 ( 22.2)         69620 ( 18.8)                
#>   bp (%)                                                           <0.001     
#>      No                    12611 ( 49.4)        315344 ( 85.0)                
#>      Yes                   12857 ( 50.4)         55037 ( 14.8)                
#>      NA                       56 (  0.2)           740 (  0.2)                
#>   copd (%)                                                         <0.001     
#>      No                    23378 ( 91.6)        267481 ( 72.1)                
#>      Yes                    1449 (  5.7)          3043 (  0.8)                
#>      NA                      697 (  2.7)        100597 ( 27.1)                
#>   diab (%)                                                         <0.001     
#>      No                    20461 ( 80.2)        353817 ( 95.3)                
#>      Yes                    5038 ( 19.7)         17138 (  4.6)                
#>      NA                       25 (  0.1)           166 (  0.0)                
#>   province = South (%)     25271 ( 99.0)        363659 ( 98.0)     <0.001     
#>   weight (mean (SD))      152.58 (181.69)       203.40 (244.28)    <0.001     
#>   cycle (%)                                                        <0.001     
#>      11                     7968 ( 31.2)        122798 ( 33.1)                
#>      21                     9027 ( 35.4)        124838 ( 33.6)                
#>      31                     8529 ( 33.4)        123485 ( 33.3)                
#>   ID (mean (SD))       199839.07 (114705.35) 198466.74 (114661.51)  0.064     
#>   OA (%)                                                           <0.001     
#>      Control               12655 ( 49.6)        301675 ( 81.3)                
#>      OA                     6522 ( 25.6)         34346 (  9.3)                
#>      NA                     6347 ( 24.9)         35100 (  9.5)                
#>   immigrate (%)                                                    <0.001     
#>      > 10 years             2295 (  9.0)         24409 (  6.6)                
#>      not immigrant         21342 ( 83.6)        316353 ( 85.2)                
#>      recent                  159 (  0.6)         10476 (  2.8)                
#>      NA                     1728 (  6.8)         19883 (  5.4)                
#>   province.check (%)                                                  NaN     
#>      NEWFOUNDLAND            519 (  2.0)          7398 (  2.0)                
#>      PEI                     567 (  2.2)          7172 (  1.9)                
#>      NOVA SCOTIA            1308 (  5.1)         14015 (  3.8)                
#>      NEW BRUNSWICK          1223 (  4.8)         13786 (  3.7)                
#>      QU\xc9BEC              1380 (  5.4)         20625 (  5.6)                
#>      ONTARIO                8596 ( 33.7)        115053 ( 31.0)                
#>      MANITOBA               1339 (  5.2)         22074 (  5.9)                
#>      SASKATCHEWAN           1542 (  6.0)         21782 (  5.9)                
#>      ALBERTA                1837 (  7.2)         38238 ( 10.3)                
#>      BRITISH COLUMBIA       2847 ( 11.2)         46834 ( 12.6)                
#>      YUKON/NWT/NUNAVT        173 (  0.7)          4884 (  1.3)                
#>      NOT APPLICABLE            0 (  0.0)             0 (  0.0)                
#>      DON'T KNOW                0 (  0.0)             0 (  0.0)                
#>      REFUSAL                   0 (  0.0)             0 (  0.0)                
#>      NOT STATED                0 (  0.0)             0 (  0.0)                
#>      QUEBEC                 3839 ( 15.0)         52850 ( 14.2)                
#>      NFLD & LAB.             274 (  1.1)          3832 (  1.0)                
#>      YUKON/NWT/NUNA.          80 (  0.3)          2578 (  0.7)
CreateTableOne(data = analytic, strata = "OA", includeNA = TRUE)
#>                       Stratified by OA
#>                        Control               OA                    p      test
#>   n                       314542                 40943                        
#>   CVD (%)                                                          <0.001     
#>      event                 12655 (  4.0)          6522 ( 15.9)                
#>      no event             301675 ( 95.9)         34346 ( 83.9)                
#>      NA                      212 (  0.1)            75 (  0.2)                
#>   age (%)                                                          <0.001     
#>      20-29 years           46805 ( 14.9)           537 (  1.3)                
#>      30-39 years           59233 ( 18.8)          1622 (  4.0)                
#>      40-49 years           55598 ( 17.7)          4128 ( 10.1)                
#>      50-59 years           43746 ( 13.9)          8994 ( 22.0)                
#>      60-64 years           15772 (  5.0)          5100 ( 12.5)                
#>      65 years and over     41661 ( 13.2)         20436 ( 49.9)                
#>      teen                  51727 ( 16.4)           126 (  0.3)                
#>   sex = Male (%)          153889 ( 48.9)         11627 ( 28.4)     <0.001     
#>   married (%)                                                      <0.001     
#>      not single           158065 ( 50.3)         21794 ( 53.2)                
#>      single               155952 ( 49.6)         19099 ( 46.6)                
#>      NA                      525 (  0.2)            50 (  0.1)                
#>   race (%)                                                         <0.001     
#>      Non-white             34028 ( 10.8)          1803 (  4.4)                
#>      White                273378 ( 86.9)         38241 ( 93.4)                
#>      NA                     7136 (  2.3)           899 (  2.2)                
#>   edu (%)                                                          <0.001     
#>      < 2ndary              92831 ( 29.5)         14539 ( 35.5)                
#>      2nd grad.             52077 ( 16.6)          6291 ( 15.4)                
#>      Other 2nd grad.       24099 (  7.7)          2484 (  6.1)                
#>      Post-2nd grad.       140400 ( 44.6)         16887 ( 41.2)                
#>      NA                     5135 (  1.6)           742 (  1.8)                
#>   income (%)                                                       <0.001     
#>      $29,999 or less       68530 ( 21.8)         16233 ( 39.6)                
#>      $30,000-$49,999       61697 ( 19.6)          8360 ( 20.4)                
#>      $50,000-$79,999       72657 ( 23.1)          6348 ( 15.5)                
#>      $80,000 or more       67458 ( 21.4)          4191 ( 10.2)                
#>      NA                    44200 ( 14.1)          5811 ( 14.2)                
#>   bmi (%)                                                          <0.001     
#>      Underweight            8660 (  2.8)           715 (  1.7)                
#>      healthy weight       123416 ( 39.2)         12631 ( 30.9)                
#>      Overweight           123898 ( 39.4)         20715 ( 50.6)                
#>      NA                    58568 ( 18.6)          6882 ( 16.8)                
#>   phyact (%)                                                       <0.001     
#>      Active                84269 ( 26.8)          6968 ( 17.0)                
#>      Inactive             143058 ( 45.5)         23604 ( 57.7)                
#>      Moderate              75703 ( 24.1)          9176 ( 22.4)                
#>      NA                    11512 (  3.7)          1195 (  2.9)                
#>   doctor (%)                                                       <0.001     
#>      No                    53335 ( 17.0)          2221 (  5.4)                
#>      Yes                  260802 ( 82.9)         38717 ( 94.6)                
#>      NA                      405 (  0.1)             5 (  0.0)                
#>   stress (%)                                                       <0.001     
#>      Not too stressed     223212 ( 71.0)         31769 ( 77.6)                
#>      stressed              63923 ( 20.3)          8998 ( 22.0)                
#>      NA                    27407 (  8.7)           176 (  0.4)                
#>   smoke (%)                                                        <0.001     
#>      Current smoker        79521 ( 25.3)          8087 ( 19.8)                
#>      Former smoker        117745 ( 37.4)         20267 ( 49.5)                
#>      Never smoker         116006 ( 36.9)         12428 ( 30.4)                
#>      NA                     1270 (  0.4)           161 (  0.4)                
#>   drink (%)                                                        <0.001     
#>      Current drinker      239223 ( 76.1)         28622 ( 69.9)                
#>      Former driker         37042 ( 11.8)          8668 ( 21.2)                
#>      Never drank           34185 ( 10.9)          3128 (  7.6)                
#>      NA                     4092 (  1.3)           525 (  1.3)                
#>   fruit (%)                                                        <0.001     
#>      0-3 daily serving     68629 ( 21.8)          6571 ( 16.0)                
#>      4-6 daily serving    125177 ( 39.8)         17214 ( 42.0)                
#>      6+ daily serving      62121 ( 19.7)          9123 ( 22.3)                
#>      NA                    58615 ( 18.6)          8035 ( 19.6)                
#>   bp (%)                                                           <0.001     
#>      No                   275443 ( 87.6)         25551 ( 62.4)                
#>      Yes                   38442 ( 12.2)         15341 ( 37.5)                
#>      NA                      657 (  0.2)            51 (  0.1)                
#>   copd (%)                                                         <0.001     
#>      No                   213719 ( 67.9)         39007 ( 95.3)                
#>      Yes                    2131 (  0.7)          1214 (  3.0)                
#>      NA                    98692 ( 31.4)           722 (  1.8)                
#>   diab (%)                                                         <0.001     
#>      No                   301943 ( 96.0)         36211 ( 88.4)                
#>      Yes                   12442 (  4.0)          4705 ( 11.5)                
#>      NA                      157 (  0.0)            27 (  0.1)                
#>   province = South (%)    307761 ( 97.8)         40507 ( 98.9)     <0.001     
#>   weight (mean (SD))      211.50 (251.46)       159.00 (188.84)    <0.001     
#>   cycle (%)                                                        <0.001     
#>      11                   106231 ( 33.8)         12052 ( 29.4)                
#>      21                   104530 ( 33.2)         14750 ( 36.0)                
#>      31                   103781 ( 33.0)         14141 ( 34.5)                
#>   ID (mean (SD))       197003.20 (115147.95) 204459.43 (113014.25) <0.001     
#>   OA (%)                                                              NaN     
#>      Control              314542 (100.0)             0 (  0.0)                
#>      OA                        0 (  0.0)         40943 (100.0)                
#>      NA                        0 (  0.0)             0 (  0.0)                
#>   immigrate (%)                                                    <0.001     
#>      > 10 years            19385 (  6.2)          3622 (  8.8)                
#>      not immigrant        268962 ( 85.5)         34509 ( 84.3)                
#>      recent                10187 (  3.2)           151 (  0.4)                
#>      NA                    16008 (  5.1)          2661 (  6.5)                
#>   province.check (%)                                                  NaN     
#>      NEWFOUNDLAND           6315 (  2.0)           725 (  1.8)                
#>      PEI                    5892 (  1.9)           817 (  2.0)                
#>      NOVA SCOTIA           11081 (  3.5)          1880 (  4.6)                
#>      NEW BRUNSWICK         11517 (  3.7)          1693 (  4.1)                
#>      QU\xc9BEC             19111 (  6.1)          2035 (  5.0)                
#>      ONTARIO               95651 ( 30.4)         13669 ( 33.4)                
#>      MANITOBA              18050 (  5.7)          2272 (  5.5)                
#>      SASKATCHEWAN          17941 (  5.7)          2166 (  5.3)                
#>      ALBERTA               32207 ( 10.2)          3608 (  8.8)                
#>      BRITISH COLUMBIA      40034 ( 12.7)          4873 ( 11.9)                
#>      YUKON/NWT/NUNAVT       4446 (  1.4)           273 (  0.7)                
#>      NOT APPLICABLE            0 (  0.0)             0 (  0.0)                
#>      DON'T KNOW                0 (  0.0)             0 (  0.0)                
#>      REFUSAL                   0 (  0.0)             0 (  0.0)                
#>      NOT STATED                0 (  0.0)             0 (  0.0)                
#>      QUEBEC                46817 ( 14.9)          6366 ( 15.5)                
#>      NFLD & LAB.            3145 (  1.0)           403 (  1.0)                
#>      YUKON/NWT/NUNA.        2335 (  0.7)           163 (  0.4)

require(DataExplorer)
plot_missing(analytic)
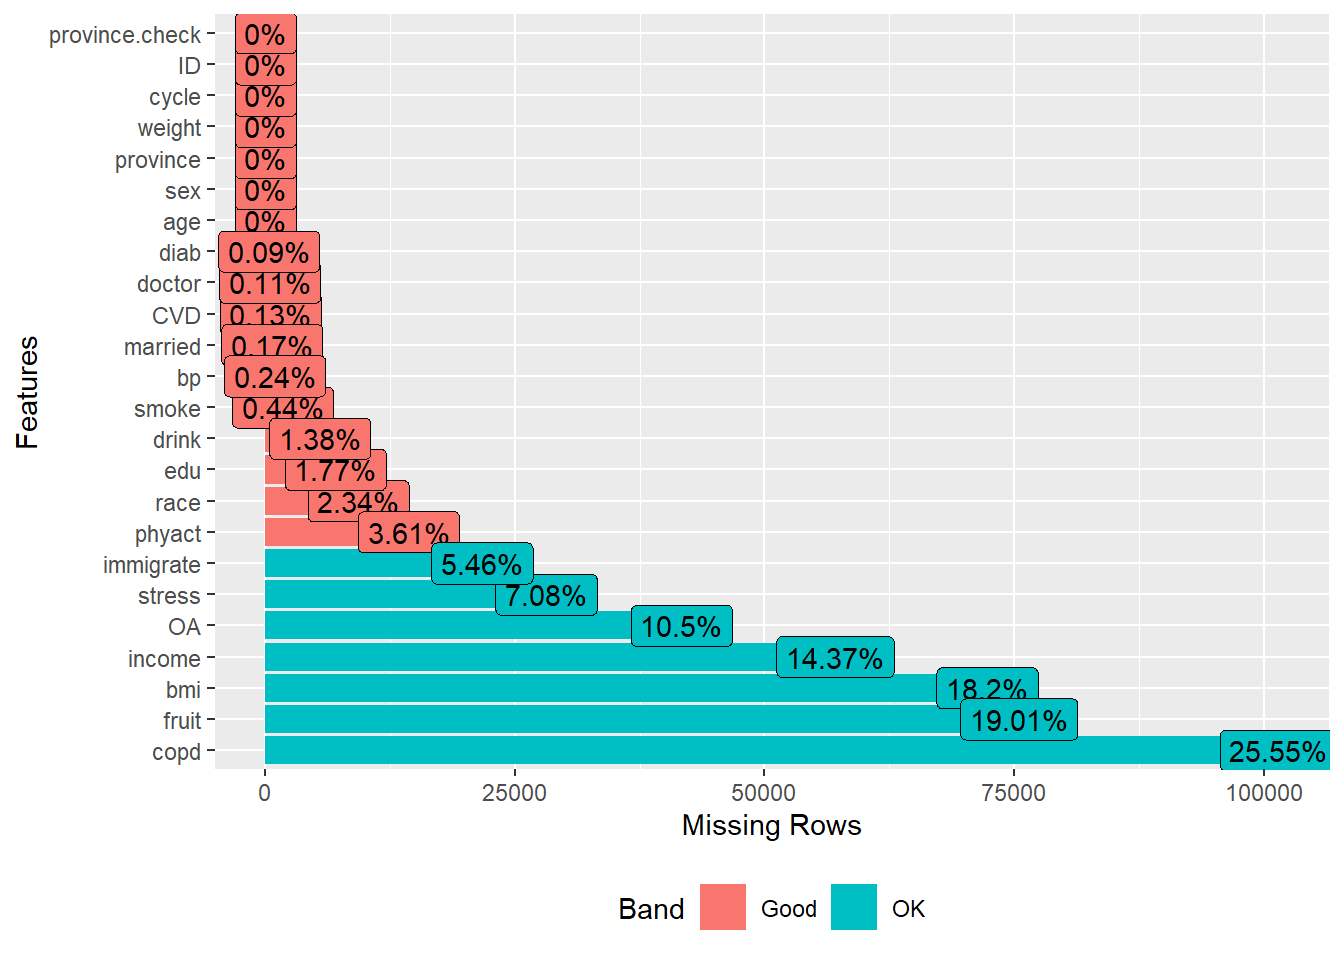
Look for zero-cells

Creates two new variables based on age groups and generates summary tables. It also comments on the presence of ‘zero cells’ in one of the variables, which might require further handling.

analytic$age.65p <- analytic$age.teen <- 0
analytic$age.teen[analytic$age == "teen"] <- 1
analytic$age.65p[analytic$age == "65 years and over"] <- 1
CreateTableOne(data = analytic, strata = "age.teen", includeNA = TRUE)
#>                       Stratified by age.teen
#>                        0                     1                     p      test
#>   n                       344786                 52387                        
#>   CVD (%)                                                          <0.001     
#>      event                 25259 ( 7.3)            265 (  0.5)                
#>      no event             319031 (92.5)          52090 ( 99.4)                
#>      NA                      496 ( 0.1)             32 (  0.1)                
#>   age (%)                                                          <0.001     
#>      20-29 years           48652 (14.1)              0 (  0.0)                
#>      30-39 years           63810 (18.5)              0 (  0.0)                
#>      40-49 years           65111 (18.9)              0 (  0.0)                
#>      50-59 years           61035 (17.7)              0 (  0.0)                
#>      60-64 years           25265 ( 7.3)              0 (  0.0)                
#>      65 years and over     80913 (23.5)              0 (  0.0)                
#>      teen                      0 ( 0.0)          52387 (100.0)                
#>   sex = Male (%)          155980 (45.2)          26543 ( 50.7)     <0.001     
#>   married (%)                                                      <0.001     
#>      not single           201528 (58.5)            685 (  1.3)                
#>      single               142639 (41.4)          51660 ( 98.6)                
#>      NA                      619 ( 0.2)             42 (  0.1)                
#>   race (%)                                                         <0.001     
#>      Non-white             31107 ( 9.0)           7534 ( 14.4)                
#>      White                305497 (88.6)          43725 ( 83.5)                
#>      NA                     8182 ( 2.4)           1128 (  2.2)                
#>   edu (%)                                                          <0.001     
#>      < 2ndary              83649 (24.3)          40776 ( 77.8)                
#>      2nd grad.             59205 (17.2)           5548 ( 10.6)                
#>      Other 2nd grad.       24580 ( 7.1)           4420 (  8.4)                
#>      Post-2nd grad.       170707 (49.5)           1265 (  2.4)                
#>      NA                     6645 ( 1.9)            378 (  0.7)                
#>   income (%)                                                       <0.001     
#>      $29,999 or less       93630 (27.2)           7701 ( 14.7)                
#>      $30,000-$49,999       69798 (20.2)           8142 ( 15.5)                
#>      $50,000-$79,999       73596 (21.3)          11512 ( 22.0)                
#>      $80,000 or more       63697 (18.5)          12018 ( 22.9)                
#>      NA                    44065 (12.8)          13014 ( 24.8)                
#>   bmi (%)                                                          <0.001     
#>      Underweight            7277 ( 2.1)           2839 (  5.4)                
#>      healthy weight       138611 (40.2)           9922 ( 18.9)                
#>      Overweight           163701 (47.5)           2520 (  4.8)                
#>      NA                    35197 (10.2)          37106 ( 70.8)                
#>   phyact (%)                                                       <0.001     
#>      Active                74738 (21.7)          23833 ( 45.5)                
#>      Inactive             176573 (51.2)          14166 ( 27.0)                
#>      Moderate              82158 (23.8)          11349 ( 21.7)                
#>      NA                    11317 ( 3.3)           3039 (  5.8)                
#>   doctor (%)                                                       <0.001     
#>      No                    49874 (14.5)           8749 ( 16.7)                
#>      Yes                  294763 (85.5)          43342 ( 82.7)                
#>      NA                      149 ( 0.0)            296 (  0.6)                
#>   stress (%)                                                       <0.001     
#>      Not too stressed     265391 (77.0)          21353 ( 40.8)                
#>      stressed              78044 (22.6)           4253 (  8.1)                
#>      NA                     1351 ( 0.4)          26781 ( 51.1)                
#>   smoke (%)                                                        <0.001     
#>      Current smoker        88986 (25.8)           8866 ( 16.9)                
#>      Former smoker        150004 (43.5)           7566 ( 14.4)                
#>      Never smoker         104332 (30.3)          35685 ( 68.1)                
#>      NA                     1464 ( 0.4)            270 (  0.5)                
#>   drink (%)                                                        <0.001     
#>      Current drinker      268269 (77.8)          27464 ( 52.4)                
#>      Former driker         50929 (14.8)           4370 (  8.3)                
#>      Never drank           20754 ( 6.0)          19916 ( 38.0)                
#>      NA                     4834 ( 1.4)            637 (  1.2)                
#>   fruit (%)                                                        <0.001     
#>      0-3 daily serving     72392 (21.0)          11049 ( 21.1)                
#>      4-6 daily serving    139753 (40.5)          19627 ( 37.5)                
#>      6+ daily serving      66831 (19.4)          12026 ( 23.0)                
#>      NA                    65810 (19.1)           9685 ( 18.5)                
#>   bp (%)                                                           <0.001     
#>      No                   276318 (80.1)          51846 ( 99.0)                
#>      Yes                   67763 (19.7)            308 (  0.6)                
#>      NA                      705 ( 0.2)            233 (  0.4)                
#>   copd (%)                                                         <0.001     
#>      No                   291191 (84.5)              0 (  0.0)                
#>      Yes                    4508 ( 1.3)              0 (  0.0)                
#>      NA                    49087 (14.2)          52387 (100.0)                
#>   diab (%)                                                         <0.001     
#>      No                   322448 (93.5)          52141 ( 99.5)                
#>      Yes                   22032 ( 6.4)            199 (  0.4)                
#>      NA                      306 ( 0.1)             47 (  0.1)                
#>   province = South (%)    338450 (98.2)          51001 ( 97.4)     <0.001     
#>   weight (mean (SD))      201.76 (245.97)       189.09 (205.24)    <0.001     
#>   cycle (%)                                                        <0.001     
#>      11                   113323 (32.9)          17557 ( 33.5)                
#>      21                   115548 (33.5)          18524 ( 35.4)                
#>      31                   115915 (33.6)          16306 ( 31.1)                
#>   ID (mean (SD))       199143.77 (114810.36) 194922.59 (113553.38) <0.001     
#>   OA (%)                                                           <0.001     
#>      Control              262815 (76.2)          51727 ( 98.7)                
#>      OA                    40817 (11.8)            126 (  0.2)                
#>      NA                    41154 (11.9)            534 (  1.0)                
#>   immigrate (%)                                                    <0.001     
#>      > 10 years            25976 ( 7.5)            770 (  1.5)                
#>      not immigrant        289651 (84.0)          48427 ( 92.4)                
#>      recent                 8710 ( 2.5)           1934 (  3.7)                
#>      NA                    20449 ( 5.9)           1256 (  2.4)                
#>   province.check (%)                                                  NaN     
#>      NEWFOUNDLAND           6646 ( 1.9)           1278 (  2.4)                
#>      PEI                    6802 ( 2.0)            942 (  1.8)                
#>      NOVA SCOTIA           13337 ( 3.9)           2004 (  3.8)                
#>      NEW BRUNSWICK         13057 ( 3.8)           1968 (  3.8)                
#>      QU\xc9BEC             19186 ( 5.6)           2826 (  5.4)                
#>      ONTARIO              107768 (31.3)          16053 ( 30.6)                
#>      MANITOBA              20362 ( 5.9)           3092 (  5.9)                
#>      SASKATCHEWAN          20160 ( 5.8)           3201 (  6.1)                
#>      ALBERTA               34293 ( 9.9)           5834 ( 11.1)                
#>      BRITISH COLUMBIA      43431 (12.6)           6336 ( 12.1)                
#>      YUKON/NWT/NUNAVT       4170 ( 1.2)            894 (  1.7)                
#>      NOT APPLICABLE            0 ( 0.0)              0 (  0.0)                
#>      DON'T KNOW                0 ( 0.0)              0 (  0.0)                
#>      REFUSAL                   0 ( 0.0)              0 (  0.0)                
#>      NOT STATED                0 ( 0.0)              0 (  0.0)                
#>      QUEBEC                49806 (14.4)           6958 ( 13.3)                
#>      NFLD & LAB.            3602 ( 1.0)            509 (  1.0)                
#>      YUKON/NWT/NUNA.        2166 ( 0.6)            492 (  0.9)                
#>   age.teen (mean (SD))      0.00 (0.00)           1.00 (0.00)      <0.001     
#>   age.65p (mean (SD))       0.23 (0.42)           0.00 (0.00)      <0.001
# copd has zero cells
# analytic$age[analytic$age == 'teen'] <- NA (will set this if we use copd)
CreateTableOne(data = analytic, strata = "age.65p", includeNA = TRUE)
#>                       Stratified by age.65p
#>                        0                     1                     p      test
#>   n                       316260                 80913                        
#>   CVD (%)                                                          <0.001     
#>      event                  9028 ( 2.9)          16496 ( 20.4)                
#>      no event             306923 (97.0)          64198 ( 79.3)                
#>      NA                      309 ( 0.1)            219 (  0.3)                
#>   age (%)                                                          <0.001     
#>      20-29 years           48652 (15.4)              0 (  0.0)                
#>      30-39 years           63810 (20.2)              0 (  0.0)                
#>      40-49 years           65111 (20.6)              0 (  0.0)                
#>      50-59 years           61035 (19.3)              0 (  0.0)                
#>      60-64 years           25265 ( 8.0)              0 (  0.0)                
#>      65 years and over         0 ( 0.0)          80913 (100.0)                
#>      teen                  52387 (16.6)              0 (  0.0)                
#>   sex = Male (%)          150152 (47.5)          32371 ( 40.0)     <0.001     
#>   married (%)                                                      <0.001     
#>      not single           163660 (51.7)          38553 ( 47.6)                
#>      single               152077 (48.1)          42222 ( 52.2)                
#>      NA                      523 ( 0.2)            138 (  0.2)                
#>   race (%)                                                         <0.001     
#>      Non-white             35329 (11.2)           3312 (  4.1)                
#>      White                274000 (86.6)          75222 ( 93.0)                
#>      NA                     6931 ( 2.2)           2379 (  2.9)                
#>   edu (%)                                                          <0.001     
#>      < 2ndary              84832 (26.8)          39593 ( 48.9)                
#>      2nd grad.             53974 (17.1)          10779 ( 13.3)                
#>      Other 2nd grad.       25305 ( 8.0)           3695 (  4.6)                
#>      Post-2nd grad.       147385 (46.6)          24587 ( 30.4)                
#>      NA                     4764 ( 1.5)           2259 (  2.8)                
#>   income (%)                                                       <0.001     
#>      $29,999 or less       62513 (19.8)          38818 ( 48.0)                
#>      $30,000-$49,999       62296 (19.7)          15644 ( 19.3)                
#>      $50,000-$79,999       77283 (24.4)           7825 (  9.7)                
#>      $80,000 or more       72566 (22.9)           3149 (  3.9)                
#>      NA                    41602 (13.2)          15477 ( 19.1)                
#>   bmi (%)                                                          <0.001     
#>      Underweight            8588 ( 2.7)           1528 (  1.9)                
#>      healthy weight       124932 (39.5)          23601 ( 29.2)                
#>      Overweight           136225 (43.1)          29996 ( 37.1)                
#>      NA                    46515 (14.7)          25788 ( 31.9)                
#>   phyact (%)                                                       <0.001     
#>      Active                85384 (27.0)          13187 ( 16.3)                
#>      Inactive             144019 (45.5)          46720 ( 57.7)                
#>      Moderate              76602 (24.2)          16905 ( 20.9)                
#>      NA                    10255 ( 3.2)           4101 (  5.1)                
#>   doctor (%)                                                       <0.001     
#>      No                    53972 (17.1)           4651 (  5.7)                
#>      Yes                  261866 (82.8)          76239 ( 94.2)                
#>      NA                      422 ( 0.1)             23 (  0.0)                
#>   stress (%)                                                       <0.001     
#>      Not too stressed     215454 (68.1)          71290 ( 88.1)                
#>      stressed              73402 (23.2)           8895 ( 11.0)                
#>      NA                    27404 ( 8.7)            728 (  0.9)                
#>   smoke (%)                                                        <0.001     
#>      Current smoker        88068 (27.8)           9784 ( 12.1)                
#>      Former smoker        115111 (36.4)          42459 ( 52.5)                
#>      Never smoker         111879 (35.4)          28138 ( 34.8)                
#>      NA                     1202 ( 0.4)            532 (  0.7)                
#>   drink (%)                                                        <0.001     
#>      Current drinker      245156 (77.5)          50577 ( 62.5)                
#>      Former driker         35401 (11.2)          19898 ( 24.6)                
#>      Never drank           31888 (10.1)           8782 ( 10.9)                
#>      NA                     3815 ( 1.2)           1656 (  2.0)                
#>   fruit (%)                                                        <0.001     
#>      0-3 daily serving     72908 (23.1)          10533 ( 13.0)                
#>      4-6 daily serving    124621 (39.4)          34759 ( 43.0)                
#>      6+ daily serving      61855 (19.6)          17002 ( 21.0)                
#>      NA                    56876 (18.0)          18619 ( 23.0)                
#>   bp (%)                                                           <0.001     
#>      No                   282174 (89.2)          45990 ( 56.8)                
#>      Yes                   33346 (10.5)          34725 ( 42.9)                
#>      NA                      740 ( 0.2)            198 (  0.2)                
#>   copd (%)                                                         <0.001     
#>      No                   213221 (67.4)          77970 ( 96.4)                
#>      Yes                    1791 ( 0.6)           2717 (  3.4)                
#>      NA                   101248 (32.0)            226 (  0.3)                
#>   diab (%)                                                         <0.001     
#>      No                   305027 (96.4)          69562 ( 86.0)                
#>      Yes                   10974 ( 3.5)          11257 ( 13.9)                
#>      NA                      259 ( 0.1)             94 (  0.1)                
#>   province = South (%)    309016 (97.7)          80435 ( 99.4)     <0.001     
#>   weight (mean (SD))      215.36 (255.33)       140.38 (160.88)    <0.001     
#>   cycle (%)                                                        <0.001     
#>      11                   106647 (33.7)          24233 ( 29.9)                
#>      21                   105506 (33.4)          28566 ( 35.3)                
#>      31                   104107 (32.9)          28114 ( 34.7)                
#>   ID (mean (SD))       197072.98 (115035.66) 204504.77 (112956.66) <0.001     
#>   OA (%)                                                           <0.001     
#>      Control              272881 (86.3)          41661 ( 51.5)                
#>      OA                    20507 ( 6.5)          20436 ( 25.3)                
#>      NA                    22872 ( 7.2)          18816 ( 23.3)                
#>   immigrate (%)                                                    <0.001     
#>      > 10 years            17607 ( 5.6)           9139 ( 11.3)                
#>      not immigrant        273622 (86.5)          64456 ( 79.7)                
#>      recent                10325 ( 3.3)            319 (  0.4)                
#>      NA                    14706 ( 4.6)           6999 (  8.7)                
#>   province.check (%)                                                  NaN     
#>      NEWFOUNDLAND           6665 ( 2.1)           1259 (  1.6)                
#>      PEI                    5993 ( 1.9)           1751 (  2.2)                
#>      NOVA SCOTIA           11896 ( 3.8)           3445 (  4.3)                
#>      NEW BRUNSWICK         11856 ( 3.7)           3169 (  3.9)                
#>      QU\xc9BEC             18128 ( 5.7)           3884 (  4.8)                
#>      ONTARIO               97660 (30.9)          26161 ( 32.3)                
#>      MANITOBA              17967 ( 5.7)           5487 (  6.8)                
#>      SASKATCHEWAN          17507 ( 5.5)           5854 (  7.2)                
#>      ALBERTA               33445 (10.6)           6682 (  8.3)                
#>      BRITISH COLUMBIA      39394 (12.5)          10373 ( 12.8)                
#>      YUKON/NWT/NUNAVT       4765 ( 1.5)            299 (  0.4)                
#>      NOT APPLICABLE            0 ( 0.0)              0 (  0.0)                
#>      DON'T KNOW                0 ( 0.0)              0 (  0.0)                
#>      REFUSAL                   0 ( 0.0)              0 (  0.0)                
#>      NOT STATED                0 ( 0.0)              0 (  0.0)                
#>      QUEBEC                45226 (14.3)          11538 ( 14.3)                
#>      NFLD & LAB.            3279 ( 1.0)            832 (  1.0)                
#>      YUKON/NWT/NUNA.        2479 ( 0.8)            179 (  0.2)                
#>   age.teen (mean (SD))      0.17 (0.37)           0.00 (0.00)      <0.001     
#>   age.65p (mean (SD))       0.00 (0.00)           1.00 (0.00)      <0.001
analytic$age.65p <- analytic$age.teen <- NULL

Produces frequency tables for multiple variable combinations to check the distribution of the data and identify issues.

table(analytic$province.check,analytic$fruit)
#>                   
#>                    0-3 daily serving 4-6 daily serving 6+ daily serving
#>   NEWFOUNDLAND                  2991              3401             1237
#>   PEI                           2280              3654             1506
#>   NOVA SCOTIA                   3089              4804             1974
#>   NEW BRUNSWICK                 2989              4730             1880
#>   QU\xc9BEC                     5568             10502             5786
#>   ONTARIO                      28752             59466            30746
#>   MANITOBA                      4561              7669             3095
#>   SASKATCHEWAN                  4173              7390             3003
#>   ALBERTA                      10828             18901             8251
#>   BRITISH COLUMBIA             10726             24422            12390
#>   YUKON/NWT/NUNAVT              1829              2045             1023
#>   NOT APPLICABLE                   0                 0                0
#>   DON'T KNOW                       0                 0                0
#>   REFUSAL                          0                 0                0
#>   NOT STATED                       0                 0                0
#>   QUEBEC                        5655             12396             7966
#>   NFLD & LAB.                      0                 0                0
#>   YUKON/NWT/NUNA.                  0                 0                0
table(analytic$age)
#> 
#>       20-29 years       30-39 years       40-49 years       50-59 years 
#>             48652             63810             65111             61035 
#>       60-64 years 65 years and over              teen 
#>             25265             80913             52387
table(analytic$copd, analytic$age)
#>      
#>       20-29 years 30-39 years 40-49 years 50-59 years 60-64 years
#>   No            0       63645       64735       60203       24638
#>   Yes           0         117         320         768         586
#>      
#>       65 years and over  teen
#>   No              77970     0
#>   Yes              2717     0
table(analytic$stress, analytic$age) 
#>                   
#>                    20-29 years 30-39 years 40-49 years 50-59 years 60-64 years
#>   Not too stressed       37117       45494       45316       45226       20948
#>   stressed               11472       18197       19639       15623        4218
#>                   
#>                    65 years and over  teen
#>   Not too stressed             71290 21353
#>   stressed                      8895  4253
  • universe 15 + is not an issue for stress as age starts from 20
  • copd is problematic!

Creates tables to look at the distribution of a specific variable across different cycles (time periods) of the survey. Notes differences and issues.

  • fruit variable measured in an optional component (not available in all cycles)
table(analytic$province.check[analytic$cycle==11],
      analytic$fruit[analytic$cycle==11])
#>                   
#>                    0-3 daily serving 4-6 daily serving 6+ daily serving
#>   NEWFOUNDLAND                  1512              1643              689
#>   PEI                           1084              1738              773
#>   NOVA SCOTIA                   1732              2500             1036
#>   NEW BRUNSWICK                 1663              2363              934
#>   QU\xc9BEC                     5568             10502             5786
#>   ONTARIO                      10437             19478             8809
#>   MANITOBA                      2604              4214             1526
#>   SASKATCHEWAN                  2386              3957             1387
#>   ALBERTA                       4391              7050             2664
#>   BRITISH COLUMBIA              4321              9350             4278
#>   YUKON/NWT/NUNAVT               999              1014              448
#>   NOT APPLICABLE                   0                 0                0
#>   DON'T KNOW                       0                 0                0
#>   REFUSAL                          0                 0                0
#>   NOT STATED                       0                 0                0
#>   QUEBEC                           0                 0                0
#>   NFLD & LAB.                      0                 0                0
#>   YUKON/NWT/NUNA.                  0                 0                0
table(analytic$province.check[analytic$cycle==21],
      analytic$fruit[analytic$cycle==21])
#>                   
#>                    0-3 daily serving 4-6 daily serving 6+ daily serving
#>   NEWFOUNDLAND                  1479              1758              548
#>   PEI                            615               947              344
#>   NOVA SCOTIA                   1357              2304              938
#>   NEW BRUNSWICK                 1326              2367              946
#>   QU\xc9BEC                        0                 0                0
#>   ONTARIO                       9365             20356            10933
#>   MANITOBA                      1957              3455             1569
#>   SASKATCHEWAN                  1787              3433             1616
#>   ALBERTA                       3326              6376             3046
#>   BRITISH COLUMBIA              3186              7727             4224
#>   YUKON/NWT/NUNAVT               830              1031              575
#>   NOT APPLICABLE                   0                 0                0
#>   DON'T KNOW                       0                 0                0
#>   REFUSAL                          0                 0                0
#>   NOT STATED                       0                 0                0
#>   QUEBEC                        5655             12396             7966
#>   NFLD & LAB.                      0                 0                0
#>   YUKON/NWT/NUNA.                  0                 0                0
# a different QUEBEC spelling used
table(analytic$province.check[analytic$cycle==31],
      analytic$fruit[analytic$cycle==31])
#>                   
#>                    0-3 daily serving 4-6 daily serving 6+ daily serving
#>   NEWFOUNDLAND                     0                 0                0
#>   PEI                            581               969              389
#>   NOVA SCOTIA                      0                 0                0
#>   NEW BRUNSWICK                    0                 0                0
#>   QU\xc9BEC                        0                 0                0
#>   ONTARIO                       8950             19632            11004
#>   MANITOBA                         0                 0                0
#>   SASKATCHEWAN                     0                 0                0
#>   ALBERTA                       3111              5475             2541
#>   BRITISH COLUMBIA              3219              7345             3888
#>   YUKON/NWT/NUNAVT                 0                 0                0
#>   NOT APPLICABLE                   0                 0                0
#>   DON'T KNOW                       0                 0                0
#>   REFUSAL                          0                 0                0
#>   NOT STATED                       0                 0                0
#>   QUEBEC                           0                 0                0
#>   NFLD & LAB.                      0                 0                0
#>   YUKON/NWT/NUNA.                  0                 0                0
# The real problem!
  • Look at data dictionaries in all cycles
    • cycle 1.1 FVCADTOT Universe: All respondents
    • cycle 2.1 FVCCDTOT Universe: All respondents
    • cycle 3.1 FVCEDTOT Universe: Respondents with FVCEFOPT = 1

Below we delete or modify problematic data, and removes unnecessary variables. Checks the dimensions before and after data cleanup.

dim(analytic)
#> [1] 397173     24
analytic1 <- analytic
# analytic1$South[analytic1$province.check == "NFLD & LAB."] <- NA
# analytic1$South[analytic1$province.check == "YUKON/NWT/NUNA."] <- NA
# analytic1 <- subset(analytic, province.check != "NFLD & LAB." & 
#                       province.check != "YUKON/NWT/NUNA." )
dim(analytic1)
#> [1] 397173     24

analytic1$copd <- NULL # will bring this later for missing data analysis
# CreateTableOne(data = analytic1, strata = "OA", includeNA = TRUE)
# analytic1 <- droplevels.data.frame(analytic1)
analytic1$province.check <- NULL # we already have simplified province variable
# CreateTableOne(data = analytic1, strata = "OA", includeNA = TRUE)

Set appropriate reference

Save the original data (with missing values)!

analytic.miss <- analytic1

Relevels factors in the dataset so that a specific level is set as the reference level. This is often needed for statistical analysis.

analytic.miss$smoke <- relevel(as.factor(analytic.miss$smoke), ref='Never smoker')
analytic.miss$drink <- relevel(as.factor(analytic.miss$drink), ref='Never drank')
analytic.miss$province <- relevel(as.factor(analytic.miss$province), ref='South')
analytic.miss$immigrate <- relevel(as.factor(analytic.miss$immigrate), ref='not immigrant')

Complete data options

Creates a new dataset that omits all rows containing any missing values. This is generally not recommended for most data analysis, as it can introduce bias.

# Wrong thing to do for survey data analysis!!
analytic2 <- as.data.frame(na.omit(analytic1)) 
dim(analytic2)
#> [1] 185613     22
# tab1 <- CreateTableOne(data = analytic2, strata = "OA", includeNA = TRUE)
# print(tab1, test=FALSE, showAllLevels = TRUE)

Saving dataset

Let us check the dimensions of multiple data objects and then save them to a file for future use.

dim(cc123a)
#> [1] 397173     25
dim(analytic)
#> [1] 397173     24
dim(analytic.miss)
#> [1] 397173     22
dim(analytic2)
#> [1] 185613     22
save(analytic.miss, analytic2, file = "Data/surveydata/cchs123b.RData")

Video content (optional)

Tip

For those who prefer a video walkthrough, feel free to watch the video below, which offers a description of an earlier version of the above content.