Useful Packages
This tutorial introduces a variety of methods to explore a dataset, including summary statistics, variable distributions, correlations, and handling missing data.
This tutorial uses the same dataset as previous tutorials, including working with a predictive question, machine learning with a continuous outcome, and machine learning with a binary outcome.
TableOne
TableOne is an R package that provides a simple method to create the classic “Table 1” seen in health research papers, summarizing the characteristics of the dataset. It also offers functions like svyCreateTableOne for survey data, allowing users to account for strata and weights, and display counts and proportions for both weighted and unweighted data.
CreateTableOne(vars = c("Disease.category", "Cancer", "Cardiovascular", "Congestive.HF",
                        "Dementia", "Psychiatric", "Pulmonary", "Renal", "Hepatic", "GI.Bleed", "Tumor",
                        "Immunosuppression", "Transfer.hx", "MI", "age", "sex", "edu", "DASIndex",
                        "APACHE.score", "Glasgow.Coma.Score", "blood.pressure", "WBC", "Heart.rate",
                        "Respiratory.rate", "Temperature", "PaO2vs.FIO2", "Albumin", "Hematocrit",
                        "Bilirubin", "Creatinine", "Sodium", "Potassium", "PaCo2", "PH", "Weight",
                        "DNR.status", "Medical.insurance", "Respiratory.Diag", "Cardiovascular.Diag",
                        "Neurological.Diag", "Gastrointestinal.Diag", "Renal.Diag", "Metabolic.Diag",
                        "Hematologic.Diag", "Sepsis.Diag", "Trauma.Diag", "Orthopedic.Diag", "race",
                        "income", "Length.of.Stay", "Death"),
               strata = "RHC.use",
               data = ObsData,
               includeNA = TRUE,
               test = TRUE)
#> Warning in ModuleReturnVarsExist(vars, data): The data frame does not have:
#> Immunosuppression Dropped
#>                                  Stratified by RHC.use
#>                                   0               1               p      test
#>   n                                 3551            2184
#>   Disease.category (%)                                            <0.001
#>      ARF                            1581 (44.5)      909 (41.6)
#>      CHF                             247 ( 7.0)      209 ( 9.6)
#>      Other                           955 (26.9)      208 ( 9.5)
#>      MOSF                            768 (21.6)      858 (39.3)
#>   Cancer (%)                                                       0.001
#>      None                           2652 (74.7)     1727 (79.1)
#>      Localized (Yes)                 638 (18.0)      334 (15.3)
#>      Metastatic                      261 ( 7.4)      123 ( 5.6)
#>   Cardiovascular = 1 (%)             567 (16.0)      446 (20.4)   <0.001
#>   Congestive.HF = 1 (%)              596 (16.8)      425 (19.5)    0.011
#>   Dementia = 1 (%)                   413 (11.6)      151 ( 6.9)   <0.001
#>   Psychiatric = 1 (%)                286 ( 8.1)      100 ( 4.6)   <0.001
#>   Pulmonary = 1 (%)                  774 (21.8)      315 (14.4)   <0.001
#>   Renal = 1 (%)                      149 ( 4.2)      106 ( 4.9)    0.268
#>   Hepatic = 1 (%)                    265 ( 7.5)      136 ( 6.2)    0.084
#>   GI.Bleed = 1 (%)                   131 ( 3.7)       54 ( 2.5)    0.014
#>   Tumor = 1 (%)                      872 (24.6)      444 (20.3)   <0.001
#>   Transfer.hx = 1 (%)                335 ( 9.4)      327 (15.0)   <0.001
#>   MI = 1 (%)                         105 ( 3.0)       95 ( 4.3)    0.007
#>   age (%)                                                         <0.001
#>      [-Inf,50)                       884 (24.9)      540 (24.7)
#>      [50,60)                         546 (15.4)      371 (17.0)
#>      [60,70)                         812 (22.9)      577 (26.4)
#>      [70,80)                         809 (22.8)      529 (24.2)
#>      [80, Inf)                       500 (14.1)      167 ( 7.6)
#>   sex = Female (%)                  1637 (46.1)      906 (41.5)    0.001
#>   edu (mean (SD))                  11.57 (3.13)    11.86 (3.16)    0.001
#>   DASIndex (mean (SD))             20.37 (5.48)    20.70 (5.03)    0.023
#>   APACHE.score (mean (SD))         50.93 (18.81)   60.74 (20.27)  <0.001
#>   Glasgow.Coma.Score (mean (SD))   22.25 (31.37)   18.97 (28.26)  <0.001
#>   blood.pressure (mean (SD))       84.87 (38.87)   68.20 (34.24)  <0.001
#>   WBC (mean (SD))                  15.26 (11.41)   16.27 (12.55)   0.002
#>   Heart.rate (mean (SD))          112.87 (40.94)  118.93 (41.47)  <0.001
#>   Respiratory.rate (mean (SD))     28.98 (13.95)   26.65 (14.17)  <0.001
#>   Temperature (mean (SD))          37.63 (1.74)    37.59 (1.83)    0.429
#>   PaO2vs.FIO2 (mean (SD))         240.63 (116.66) 192.43 (105.54) <0.001
#>   Albumin (mean (SD))               3.16 (0.67)     2.98 (0.93)   <0.001
#>   Hematocrit (mean (SD))           32.70 (8.79)    30.51 (7.42)   <0.001
#>   Bilirubin (mean (SD))             2.00 (4.43)     2.71 (5.33)   <0.001
#>   Creatinine (mean (SD))            1.92 (2.03)     2.47 (2.05)   <0.001
#>   Sodium (mean (SD))              137.04 (7.68)   136.33 (7.60)    0.001
#>   Potassium (mean (SD))             4.08 (1.04)     4.05 (1.01)    0.321
#>   PaCo2 (mean (SD))                39.95 (14.24)   36.79 (10.97)  <0.001
#>   PH (mean (SD))                    7.39 (0.11)     7.38 (0.11)   <0.001
#>   Weight (mean (SD))               65.04 (29.50)   72.36 (27.73)  <0.001
#>   DNR.status = Yes (%)               499 (14.1)      155 ( 7.1)   <0.001
#>   Medical.insurance (%)                                           <0.001
#>      Medicaid                        454 (12.8)      193 ( 8.8)
#>      Medicare                        947 (26.7)      511 (23.4)
#>      Medicare & Medicaid             251 ( 7.1)      123 ( 5.6)
#>      No insurance                    186 ( 5.2)      136 ( 6.2)
#>      Private                         967 (27.2)      731 (33.5)
#>      Private & Medicare              746 (21.0)      490 (22.4)
#>   Respiratory.Diag = Yes (%)        1481 (41.7)      632 (28.9)   <0.001
#>   Cardiovascular.Diag = Yes (%)     1007 (28.4)      924 (42.3)   <0.001
#>   Neurological.Diag = Yes (%)        575 (16.2)      118 ( 5.4)   <0.001
#>   Gastrointestinal.Diag = Yes (%)    522 (14.7)      420 (19.2)   <0.001
#>   Renal.Diag = Yes (%)               147 ( 4.1)      148 ( 6.8)   <0.001
#>   Metabolic.Diag = Yes (%)           172 ( 4.8)       93 ( 4.3)    0.337
#>   Hematologic.Diag = Yes (%)         239 ( 6.7)      115 ( 5.3)    0.029
#>   Sepsis.Diag = Yes (%)              515 (14.5)      516 (23.6)   <0.001
#>   Trauma.Diag = Yes (%)               18 ( 0.5)       34 ( 1.6)   <0.001
#>   Orthopedic.Diag = Yes (%)            3 ( 0.1)        4 ( 0.2)    0.516
#>   race (%)                                                         0.425
#>      white                          2753 (77.5)     1707 (78.2)
#>      black                           585 (16.5)      335 (15.3)
#>      other                           213 ( 6.0)      142 ( 6.5)
#>   income (%)                                                      <0.001
#>      $11-$25k                        713 (20.1)      452 (20.7)
#>      $25-$50k                        500 (14.1)      393 (18.0)
#>      > $50k                          257 ( 7.2)      194 ( 8.9)
#>      Under $11k                     2081 (58.6)     1145 (52.4)
#>   Length.of.Stay (mean (SD))       19.53 (23.59)   24.86 (28.90)  <0.001
#>   Death (mean (SD))                 0.63 (0.48)     0.68 (0.47)   <0.001
table1
The table1 package is useful for generating descriptive summary tables commonly used in medical research. Below are examples of how to use it.
Basic usage of table1:
ObsData$RHC.use.factor <- factor(ObsData$RHC.use,
                          levels = c(0, 1),
                          labels = c("No RHC", "Received RHC"))
# Generate a basic Table 1 summarizing characteristics of ObsData, grouped by 'RHC.use'
table1(~ age + sex + APACHE.score + Medical.insurance | RHC.use.factor, data = ObsData)| No RHC (N=3551) |
Received RHC (N=2184) |
Overall (N=5735) |
|
|---|---|---|---|
| age | |||
| [-Inf,50) | 884 (24.9%) | 540 (24.7%) | 1424 (24.8%) |
| [50,60) | 546 (15.4%) | 371 (17.0%) | 917 (16.0%) |
| [60,70) | 812 (22.9%) | 577 (26.4%) | 1389 (24.2%) |
| [70,80) | 809 (22.8%) | 529 (24.2%) | 1338 (23.3%) |
| [80, Inf) | 500 (14.1%) | 167 (7.6%) | 667 (11.6%) |
| sex | |||
| Male | 1914 (53.9%) | 1278 (58.5%) | 3192 (55.7%) |
| Female | 1637 (46.1%) | 906 (41.5%) | 2543 (44.3%) |
| APACHE.score | |||
| Mean (SD) | 50.9 (18.8) | 60.7 (20.3) | 54.7 (20.0) |
| Median [Min, Max] | 50.0 [3.00, 147] | 60.0 [9.00, 135] | 54.0 [3.00, 147] |
| Medical.insurance | |||
| Medicaid | 454 (12.8%) | 193 (8.8%) | 647 (11.3%) |
| Medicare | 947 (26.7%) | 511 (23.4%) | 1458 (25.4%) |
| Medicare & Medicaid | 251 (7.1%) | 123 (5.6%) | 374 (6.5%) |
| No insurance | 186 (5.2%) | 136 (6.2%) | 322 (5.6%) |
| Private | 967 (27.2%) | 731 (33.5%) | 1698 (29.6%) |
| Private & Medicare | 746 (21.0%) | 490 (22.4%) | 1236 (21.6%) |
Customizing labels and formats
# Label variables and modify the format
labels <- list(
  age = "Age (years)",
  APACHE.score = "APACHE II Score",
  Medical.insurance = "Medical Insurance Status"
)

table1(~ age + sex + APACHE.score + Medical.insurance | RHC.use.factor, data = ObsData,
label = labels, caption = "Table 1: Summary of patient characteristics")| No RHC (N=3551) |
Received RHC (N=2184) |
Overall (N=5735) |
|
|---|---|---|---|
| age | |||
| [-Inf,50) | 884 (24.9%) | 540 (24.7%) | 1424 (24.8%) |
| [50,60) | 546 (15.4%) | 371 (17.0%) | 917 (16.0%) |
| [60,70) | 812 (22.9%) | 577 (26.4%) | 1389 (24.2%) |
| [70,80) | 809 (22.8%) | 529 (24.2%) | 1338 (23.3%) |
| [80, Inf) | 500 (14.1%) | 167 (7.6%) | 667 (11.6%) |
| sex | |||
| Male | 1914 (53.9%) | 1278 (58.5%) | 3192 (55.7%) |
| Female | 1637 (46.1%) | 906 (41.5%) | 2543 (44.3%) |
| APACHE.score | |||
| Mean (SD) | 50.9 (18.8) | 60.7 (20.3) | 54.7 (20.0) |
| Median [Min, Max] | 50.0 [3.00, 147] | 60.0 [9.00, 135] | 54.0 [3.00, 147] |
| Medical.insurance | |||
| Medicaid | 454 (12.8%) | 193 (8.8%) | 647 (11.3%) |
| Medicare | 947 (26.7%) | 511 (23.4%) | 1458 (25.4%) |
| Medicare & Medicaid | 251 (7.1%) | 123 (5.6%) | 374 (6.5%) |
| No insurance | 186 (5.2%) | 136 (6.2%) | 322 (5.6%) |
| Private | 967 (27.2%) | 731 (33.5%) | 1698 (29.6%) |
| Private & Medicare | 746 (21.0%) | 490 (22.4%) | 1236 (21.6%) |
Handling missing data
# Including missing values in the summary table
table1(~ age + sex + APACHE.score + Medical.insurance | RHC.use.factor, data = ObsData,
overall = TRUE, render.missing = TRUE)| No RHC (N=3551) |
Received RHC (N=2184) |
TRUE (N=5735) |
|
|---|---|---|---|
| age | |||
| [-Inf,50) | 884 (24.9%) | 540 (24.7%) | 1424 (24.8%) |
| [50,60) | 546 (15.4%) | 371 (17.0%) | 917 (16.0%) |
| [60,70) | 812 (22.9%) | 577 (26.4%) | 1389 (24.2%) |
| [70,80) | 809 (22.8%) | 529 (24.2%) | 1338 (23.3%) |
| [80, Inf) | 500 (14.1%) | 167 (7.6%) | 667 (11.6%) |
| sex | |||
| Male | 1914 (53.9%) | 1278 (58.5%) | 3192 (55.7%) |
| Female | 1637 (46.1%) | 906 (41.5%) | 2543 (44.3%) |
| APACHE.score | |||
| Mean (SD) | 50.9 (18.8) | 60.7 (20.3) | 54.7 (20.0) |
| Median [Min, Max] | 50.0 [3.00, 147] | 60.0 [9.00, 135] | 54.0 [3.00, 147] |
| Medical.insurance | |||
| Medicaid | 454 (12.8%) | 193 (8.8%) | 647 (11.3%) |
| Medicare | 947 (26.7%) | 511 (23.4%) | 1458 (25.4%) |
| Medicare & Medicaid | 251 (7.1%) | 123 (5.6%) | 374 (6.5%) |
| No insurance | 186 (5.2%) | 136 (6.2%) | 322 (5.6%) |
| Private | 967 (27.2%) | 731 (33.5%) | 1698 (29.6%) |
| Private & Medicare | 746 (21.0%) | 490 (22.4%) | 1236 (21.6%) |
gtsummary
gtsummary provides highly customizable functions to construct tables. It allows renaming variables, adding captions, and selecting specific measures for variable types. It is particularly useful for creating clean, customized Table 1s and includes options for survey data.
| Characteristic | N = 5,7351 |
|---|---|
| Disease.category | |
| ARF | 2,490 (43%) |
| CHF | 456 (8.0%) |
| Other | 1,163 (20%) |
| MOSF | 1,626 (28%) |
| Cancer | |
| None | 4,379 (76%) |
| Localized (Yes) | 972 (17%) |
| Metastatic | 384 (6.7%) |
| Cardiovascular | |
| 0 | 4,722 (82%) |
| 1 | 1,013 (18%) |
| Congestive.HF | |
| 0 | 4,714 (82%) |
| 1 | 1,021 (18%) |
| Dementia | |
| 0 | 5,171 (90%) |
| 1 | 564 (9.8%) |
| Psychiatric | |
| 0 | 5,349 (93%) |
| 1 | 386 (6.7%) |
| Pulmonary | |
| 0 | 4,646 (81%) |
| 1 | 1,089 (19%) |
| Renal | |
| 0 | 5,480 (96%) |
| 1 | 255 (4.4%) |
| Hepatic | |
| 0 | 5,334 (93%) |
| 1 | 401 (7.0%) |
| GI.Bleed | |
| 0 | 5,550 (97%) |
| 1 | 185 (3.2%) |
| Tumor | |
| 0 | 4,419 (77%) |
| 1 | 1,316 (23%) |
| Immunosupperssion | |
| 0 | 4,192 (73%) |
| 1 | 1,543 (27%) |
| Transfer.hx | |
| 0 | 5,073 (88%) |
| 1 | 662 (12%) |
| MI | |
| 0 | 5,535 (97%) |
| 1 | 200 (3.5%) |
| age | |
| [-Inf,50) | 1,424 (25%) |
| [50,60) | 917 (16%) |
| [60,70) | 1,389 (24%) |
| [70,80) | 1,338 (23%) |
| [80, Inf) | 667 (12%) |
| sex | |
| Male | 3,192 (56%) |
| Female | 2,543 (44%) |
| edu | 12.0 (10.0, 13.0) |
| DASIndex | 19.7 (16.1, 23.4) |
| APACHE.score | 54 (41, 67) |
| Glasgow.Coma.Score | 0 (0, 41) |
| blood.pressure | 63 (50, 115) |
| WBC | 14 (8, 20) |
| Heart.rate | 124 (97, 141) |
| Respiratory.rate | 30 (14, 38) |
| Temperature | 38.09 (36.09, 39.00) |
| PaO2vs.FIO2 | 203 (133, 317) |
| Albumin | 3.50 (2.60, 3.50) |
| Hematocrit | 30 (26, 36) |
| Bilirubin | 1.01 (0.80, 1.40) |
| Creatinine | 1.50 (1.00, 2.40) |
| Sodium | 136 (132, 142) |
| Potassium | 3.80 (3.40, 4.60) |
| PaCo2 | 37 (31, 42) |
| PH | 7.40 (7.34, 7.46) |
| Weight | 70 (56, 84) |
| DNR.status | 654 (11%) |
| Medical.insurance | |
| Medicaid | 647 (11%) |
| Medicare | 1,458 (25%) |
| Medicare & Medicaid | 374 (6.5%) |
| No insurance | 322 (5.6%) |
| Private | 1,698 (30%) |
| Private & Medicare | 1,236 (22%) |
| Respiratory.Diag | 2,113 (37%) |
| Cardiovascular.Diag | 1,931 (34%) |
| Neurological.Diag | 693 (12%) |
| Gastrointestinal.Diag | 942 (16%) |
| Renal.Diag | 295 (5.1%) |
| Metabolic.Diag | 265 (4.6%) |
| Hematologic.Diag | 354 (6.2%) |
| Sepsis.Diag | 1,031 (18%) |
| Trauma.Diag | 52 (0.9%) |
| Orthopedic.Diag | 7 (0.1%) |
| race | |
| white | 4,460 (78%) |
| black | 920 (16%) |
| other | 355 (6.2%) |
| income | |
| $11-$25k | 1,165 (20%) |
| $25-$50k | 893 (16%) |
| > $50k | 451 (7.9%) |
| Under $11k | 3,226 (56%) |
| Length.of.Stay | 14 (7, 25) |
| Death | 3,722 (65%) |
| RHC.use | 2,184 (38%) |
| 1 n (%); Median (Q1, Q3) | |
tbl_summary(ObsData, by = RHC.use,
            statistic = list(
                              all_continuous() ~ "{mean} ({sd})",
                              all_categorical() ~ "{n} ({p}%)"
                            ),
            digits = all_continuous() ~ 2) |>
  as_gt() |>
gt::tab_source_note(gt::md("*Add note here.*"))| Characteristic |
0 N = 3,5511 |
1 N = 2,1841 |
|---|---|---|
| Disease.category | ||
| ARF | 1,581 (45%) | 909 (42%) |
| CHF | 247 (7.0%) | 209 (9.6%) |
| Other | 955 (27%) | 208 (9.5%) |
| MOSF | 768 (22%) | 858 (39%) |
| Cancer | ||
| None | 2,652 (75%) | 1,727 (79%) |
| Localized (Yes) | 638 (18%) | 334 (15%) |
| Metastatic | 261 (7.4%) | 123 (5.6%) |
| Cardiovascular | ||
| 0 | 2,984 (84%) | 1,738 (80%) |
| 1 | 567 (16%) | 446 (20%) |
| Congestive.HF | ||
| 0 | 2,955 (83%) | 1,759 (81%) |
| 1 | 596 (17%) | 425 (19%) |
| Dementia | ||
| 0 | 3,138 (88%) | 2,033 (93%) |
| 1 | 413 (12%) | 151 (6.9%) |
| Psychiatric | ||
| 0 | 3,265 (92%) | 2,084 (95%) |
| 1 | 286 (8.1%) | 100 (4.6%) |
| Pulmonary | ||
| 0 | 2,777 (78%) | 1,869 (86%) |
| 1 | 774 (22%) | 315 (14%) |
| Renal | ||
| 0 | 3,402 (96%) | 2,078 (95%) |
| 1 | 149 (4.2%) | 106 (4.9%) |
| Hepatic | ||
| 0 | 3,286 (93%) | 2,048 (94%) |
| 1 | 265 (7.5%) | 136 (6.2%) |
| GI.Bleed | ||
| 0 | 3,420 (96%) | 2,130 (98%) |
| 1 | 131 (3.7%) | 54 (2.5%) |
| Tumor | ||
| 0 | 2,679 (75%) | 1,740 (80%) |
| 1 | 872 (25%) | 444 (20%) |
| Immunosupperssion | ||
| 0 | 2,644 (74%) | 1,548 (71%) |
| 1 | 907 (26%) | 636 (29%) |
| Transfer.hx | ||
| 0 | 3,216 (91%) | 1,857 (85%) |
| 1 | 335 (9.4%) | 327 (15%) |
| MI | ||
| 0 | 3,446 (97%) | 2,089 (96%) |
| 1 | 105 (3.0%) | 95 (4.3%) |
| age | ||
| [-Inf,50) | 884 (25%) | 540 (25%) |
| [50,60) | 546 (15%) | 371 (17%) |
| [60,70) | 812 (23%) | 577 (26%) |
| [70,80) | 809 (23%) | 529 (24%) |
| [80, Inf) | 500 (14%) | 167 (7.6%) |
| sex | ||
| Male | 1,914 (54%) | 1,278 (59%) |
| Female | 1,637 (46%) | 906 (41%) |
| edu | 11.57 (3.13) | 11.86 (3.16) |
| DASIndex | 20.37 (5.48) | 20.70 (5.03) |
| APACHE.score | 50.93 (18.81) | 60.74 (20.27) |
| Glasgow.Coma.Score | 22.25 (31.37) | 18.97 (28.26) |
| blood.pressure | 84.87 (38.87) | 68.20 (34.24) |
| WBC | 15.26 (11.41) | 16.27 (12.55) |
| Heart.rate | 112.87 (40.94) | 118.93 (41.47) |
| Respiratory.rate | 28.98 (13.95) | 26.65 (14.17) |
| Temperature | 37.63 (1.74) | 37.59 (1.83) |
| PaO2vs.FIO2 | 240.63 (116.66) | 192.43 (105.54) |
| Albumin | 3.16 (0.67) | 2.98 (0.93) |
| Hematocrit | 32.70 (8.79) | 30.51 (7.42) |
| Bilirubin | 2.00 (4.43) | 2.71 (5.33) |
| Creatinine | 1.92 (2.03) | 2.47 (2.05) |
| Sodium | 137.04 (7.68) | 136.33 (7.60) |
| Potassium | 4.08 (1.04) | 4.05 (1.01) |
| PaCo2 | 39.95 (14.24) | 36.79 (10.97) |
| PH | 7.39 (0.11) | 7.38 (0.11) |
| Weight | 65.04 (29.50) | 72.36 (27.73) |
| DNR.status | 499 (14%) | 155 (7.1%) |
| Medical.insurance | ||
| Medicaid | 454 (13%) | 193 (8.8%) |
| Medicare | 947 (27%) | 511 (23%) |
| Medicare & Medicaid | 251 (7.1%) | 123 (5.6%) |
| No insurance | 186 (5.2%) | 136 (6.2%) |
| Private | 967 (27%) | 731 (33%) |
| Private & Medicare | 746 (21%) | 490 (22%) |
| Respiratory.Diag | 1,481 (42%) | 632 (29%) |
| Cardiovascular.Diag | 1,007 (28%) | 924 (42%) |
| Neurological.Diag | 575 (16%) | 118 (5.4%) |
| Gastrointestinal.Diag | 522 (15%) | 420 (19%) |
| Renal.Diag | 147 (4.1%) | 148 (6.8%) |
| Metabolic.Diag | 172 (4.8%) | 93 (4.3%) |
| Hematologic.Diag | 239 (6.7%) | 115 (5.3%) |
| Sepsis.Diag | 515 (15%) | 516 (24%) |
| Trauma.Diag | 18 (0.5%) | 34 (1.6%) |
| Orthopedic.Diag | 3 (<0.1%) | 4 (0.2%) |
| race | ||
| white | 2,753 (78%) | 1,707 (78%) |
| black | 585 (16%) | 335 (15%) |
| other | 213 (6.0%) | 142 (6.5%) |
| income | ||
| $11-$25k | 713 (20%) | 452 (21%) |
| $25-$50k | 500 (14%) | 393 (18%) |
| > $50k | 257 (7.2%) | 194 (8.9%) |
| Under $11k | 2,081 (59%) | 1,145 (52%) |
| Length.of.Stay | 19.53 (23.59) | 24.86 (28.90) |
| Death | 2,236 (63%) | 1,486 (68%) |
| 1 n (%); Mean (SD) | ||
| Add note here. | ||
DataExplorer
DataExplorer offers functions for initial data exploration, including various visualizations. Below are some examples using the RHC dataset.
The introduce function provides an overview of the dataset dimensions, variable types, and missingness.
Plot the amount of missing data per variable:
plot_missing(ObsData)
#> Warning: `aes_string()` was deprecated in ggplot2 3.0.0.
#> ℹ Please use tidy evaluation idioms with `aes()`.
#> ℹ See also `vignette("ggplot2-in-packages")` for more information.
#> ℹ The deprecated feature was likely used in the DataExplorer package.
#>   Please report the issue at
#>   <https://github.com/boxuancui/DataExplorer/issues>.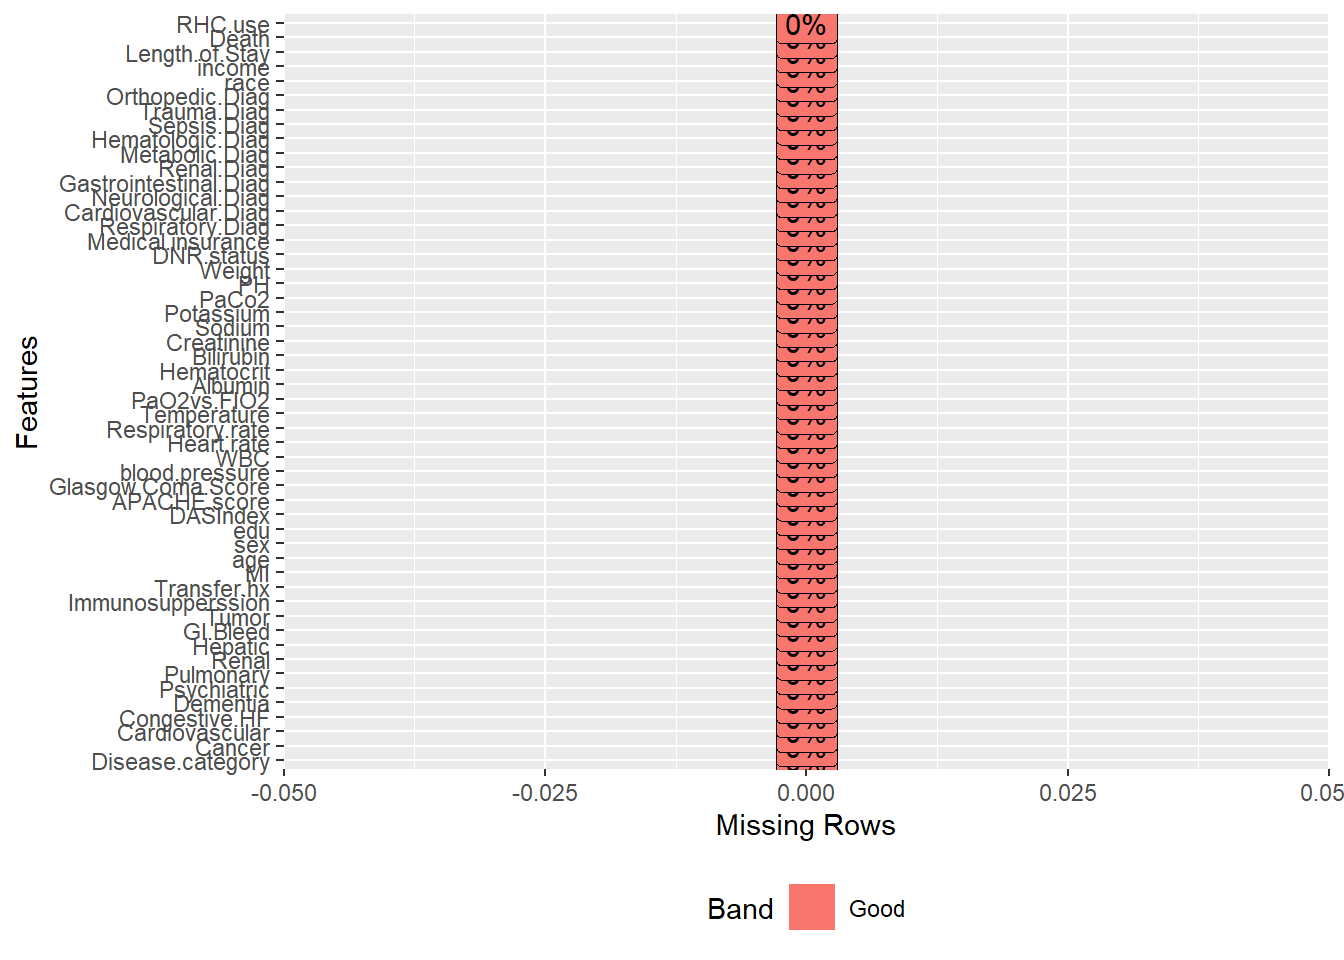
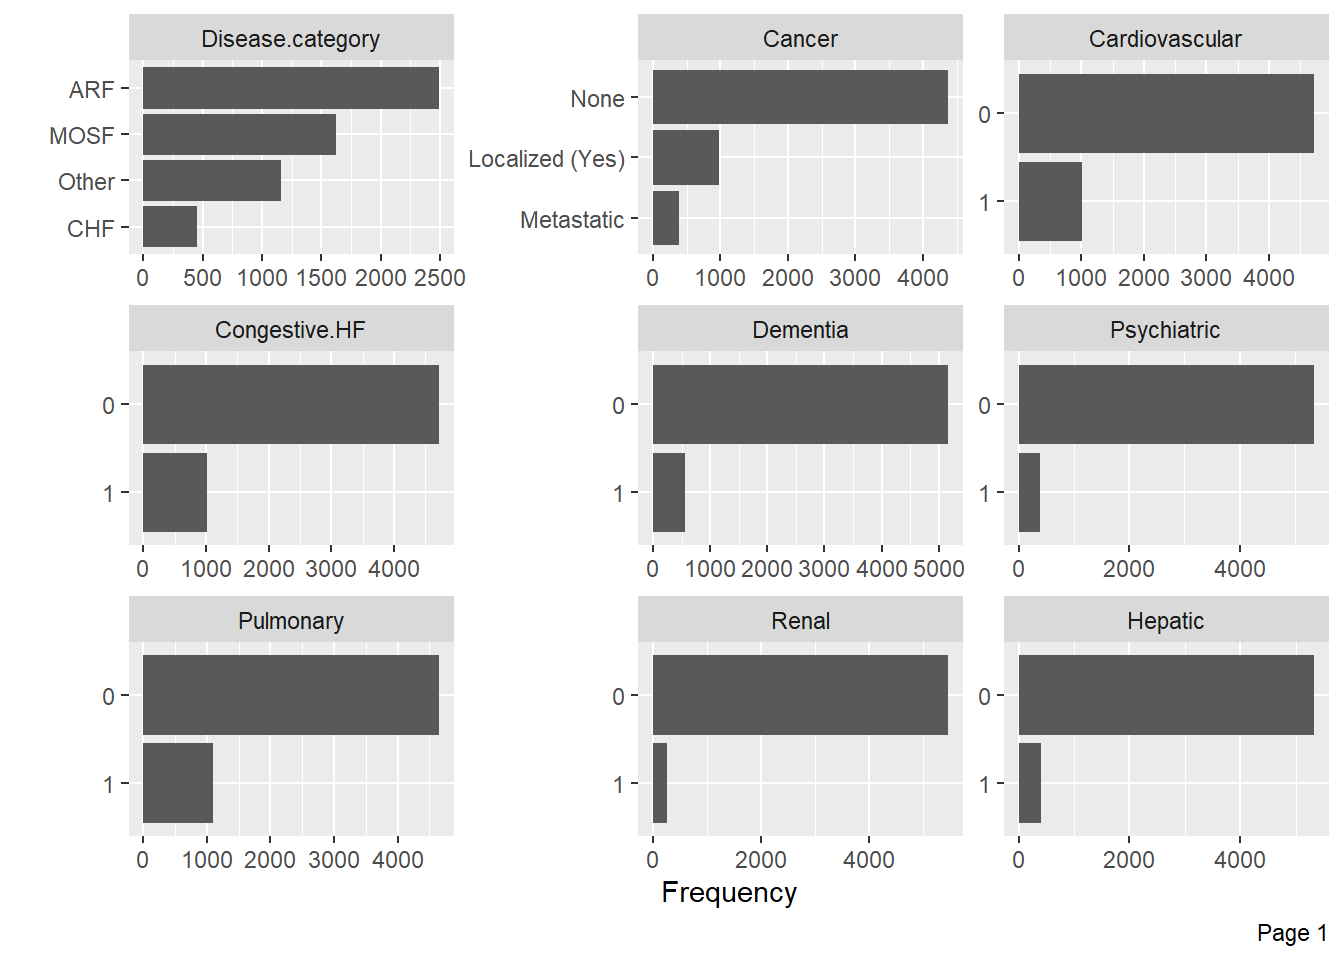
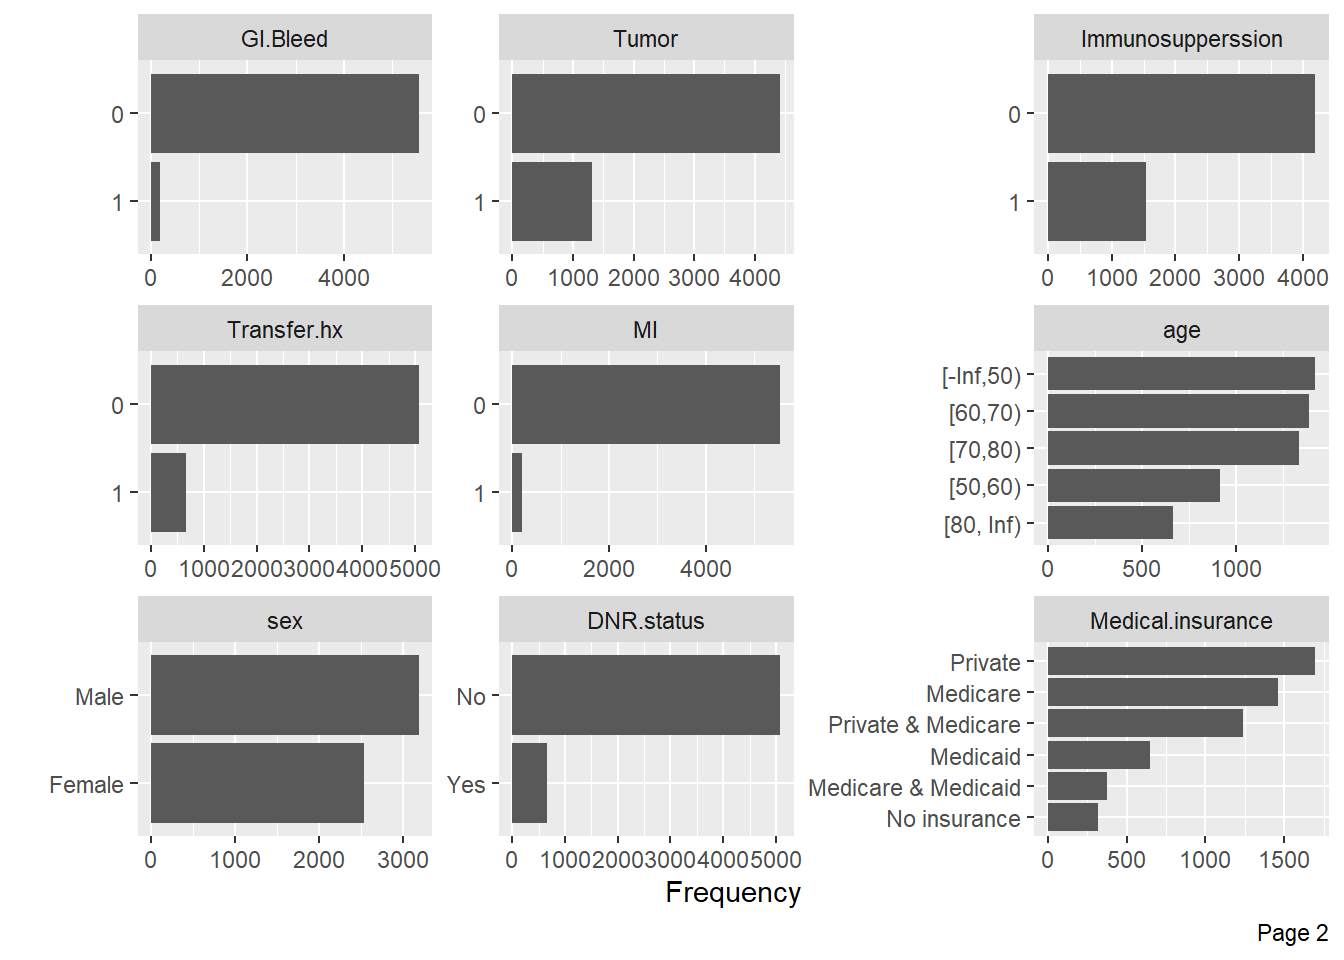
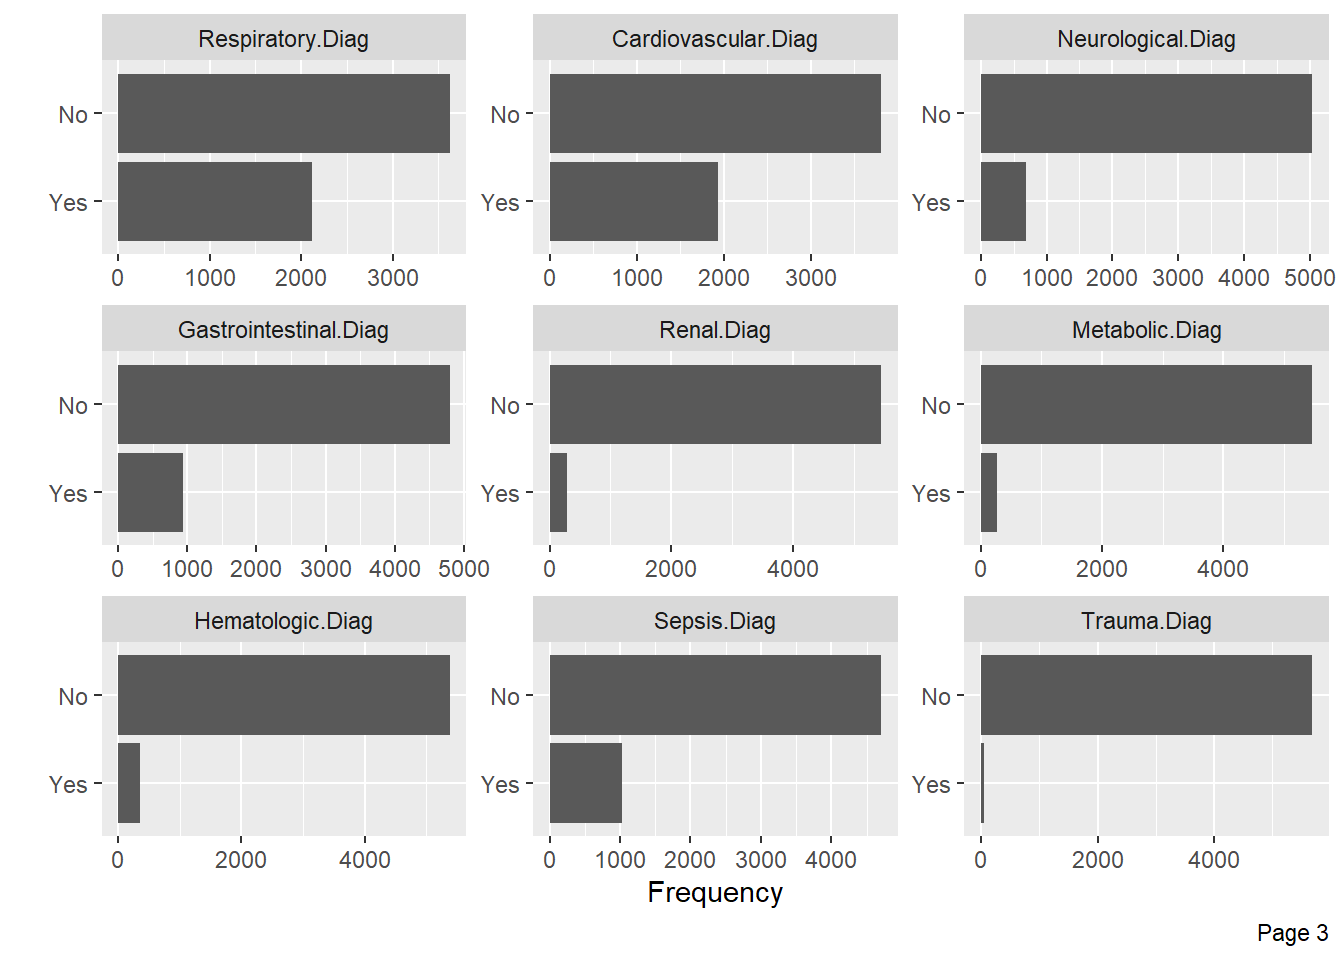
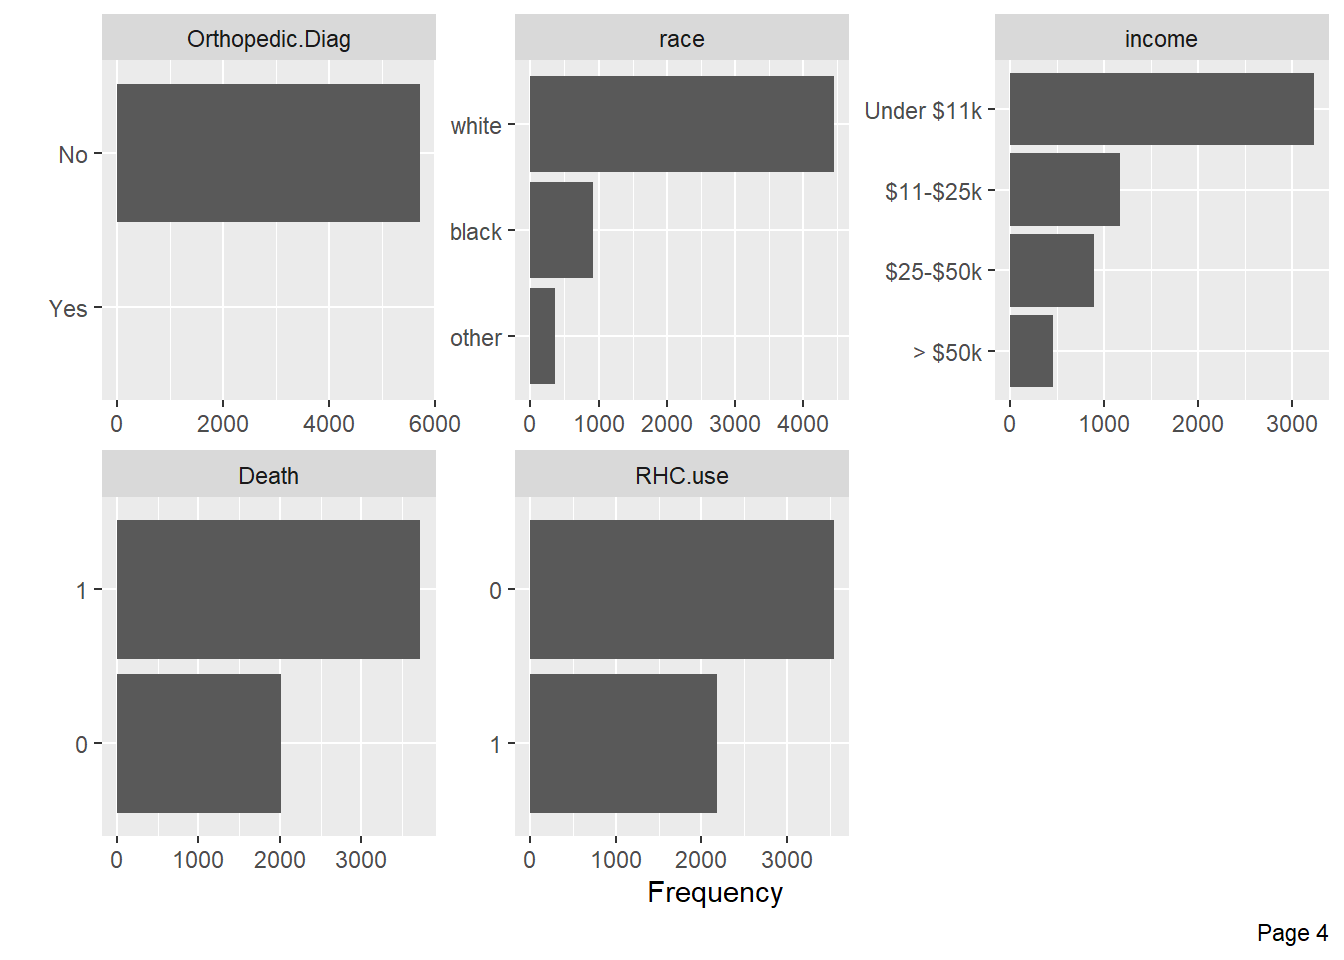
Visualize categorical variable distributions with the plot_bar function:
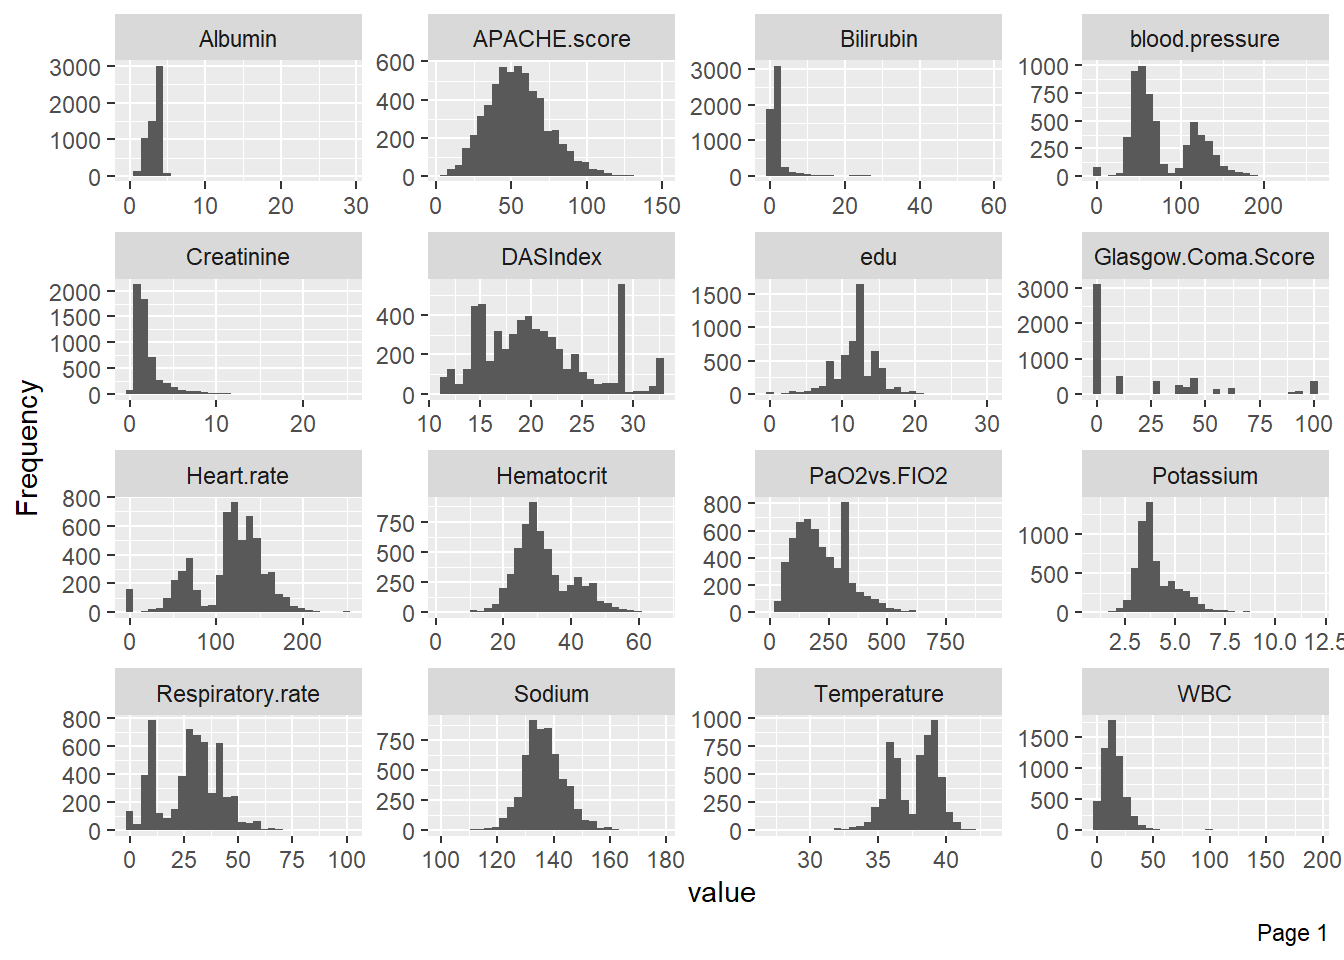
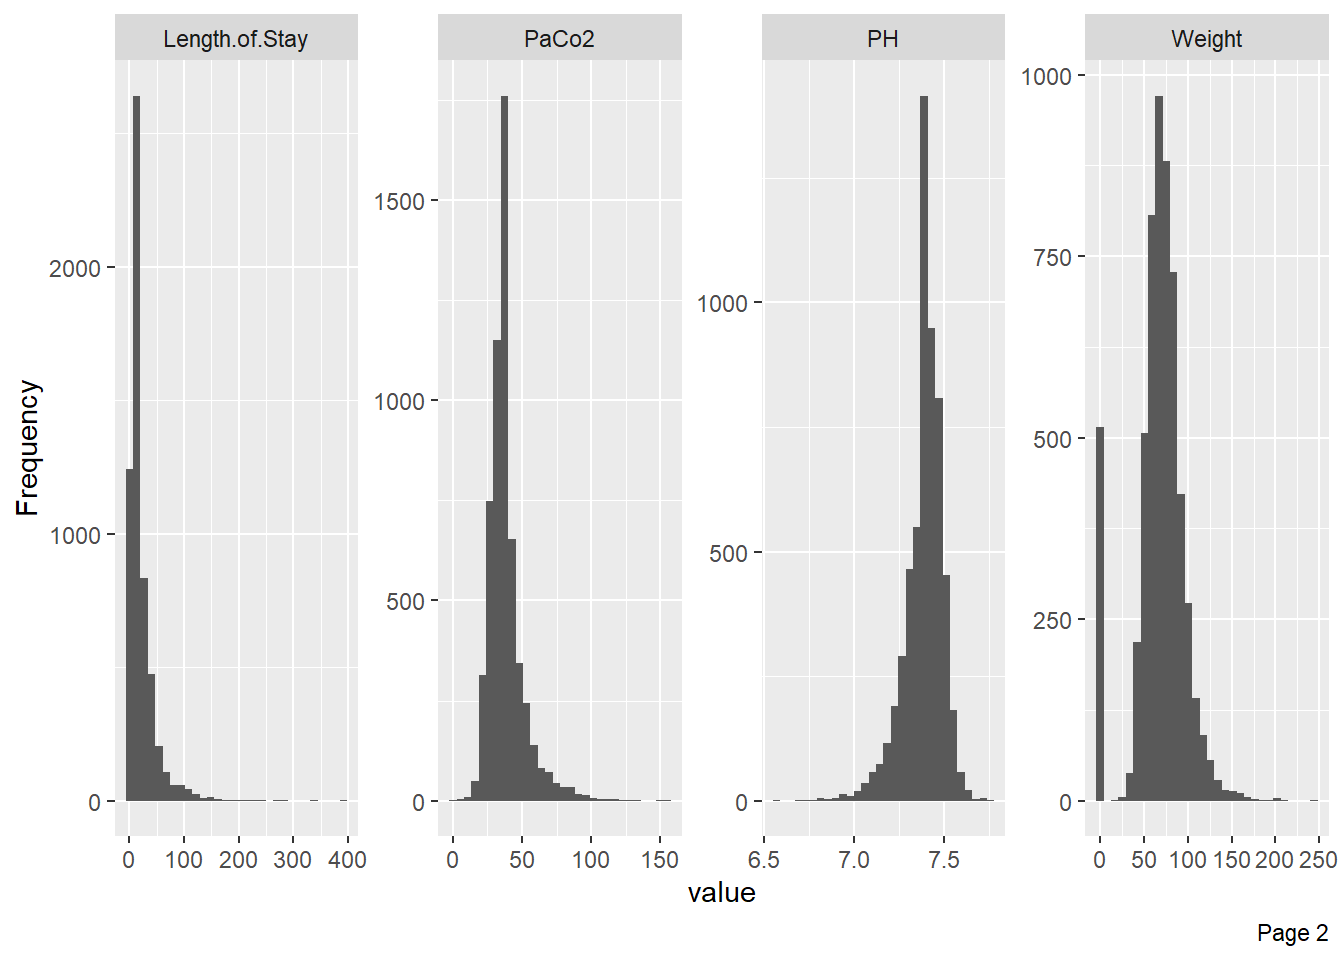
Visualize the distribution of numerical variables with histograms:
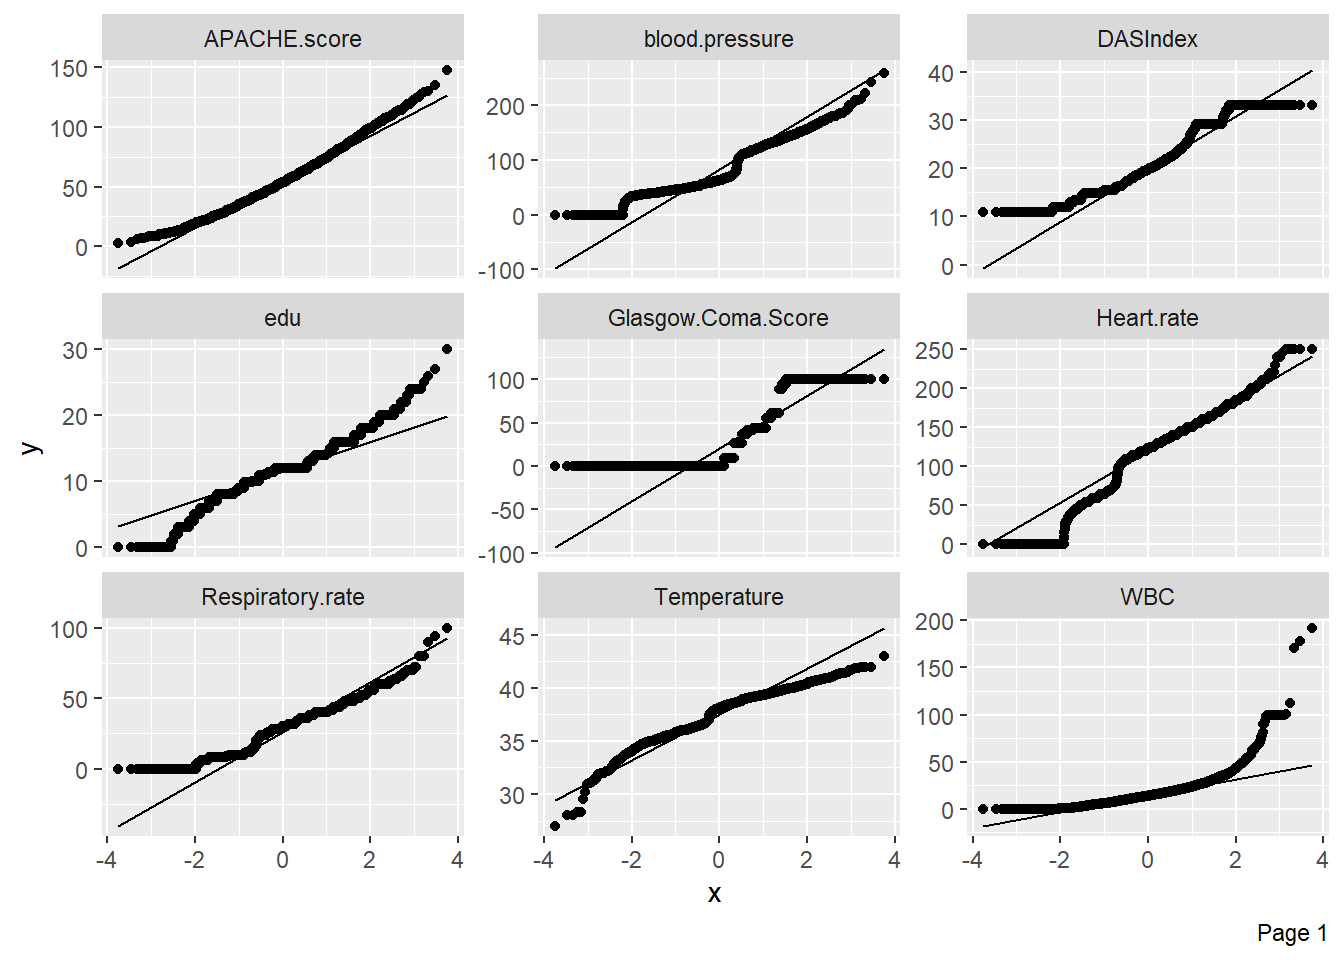
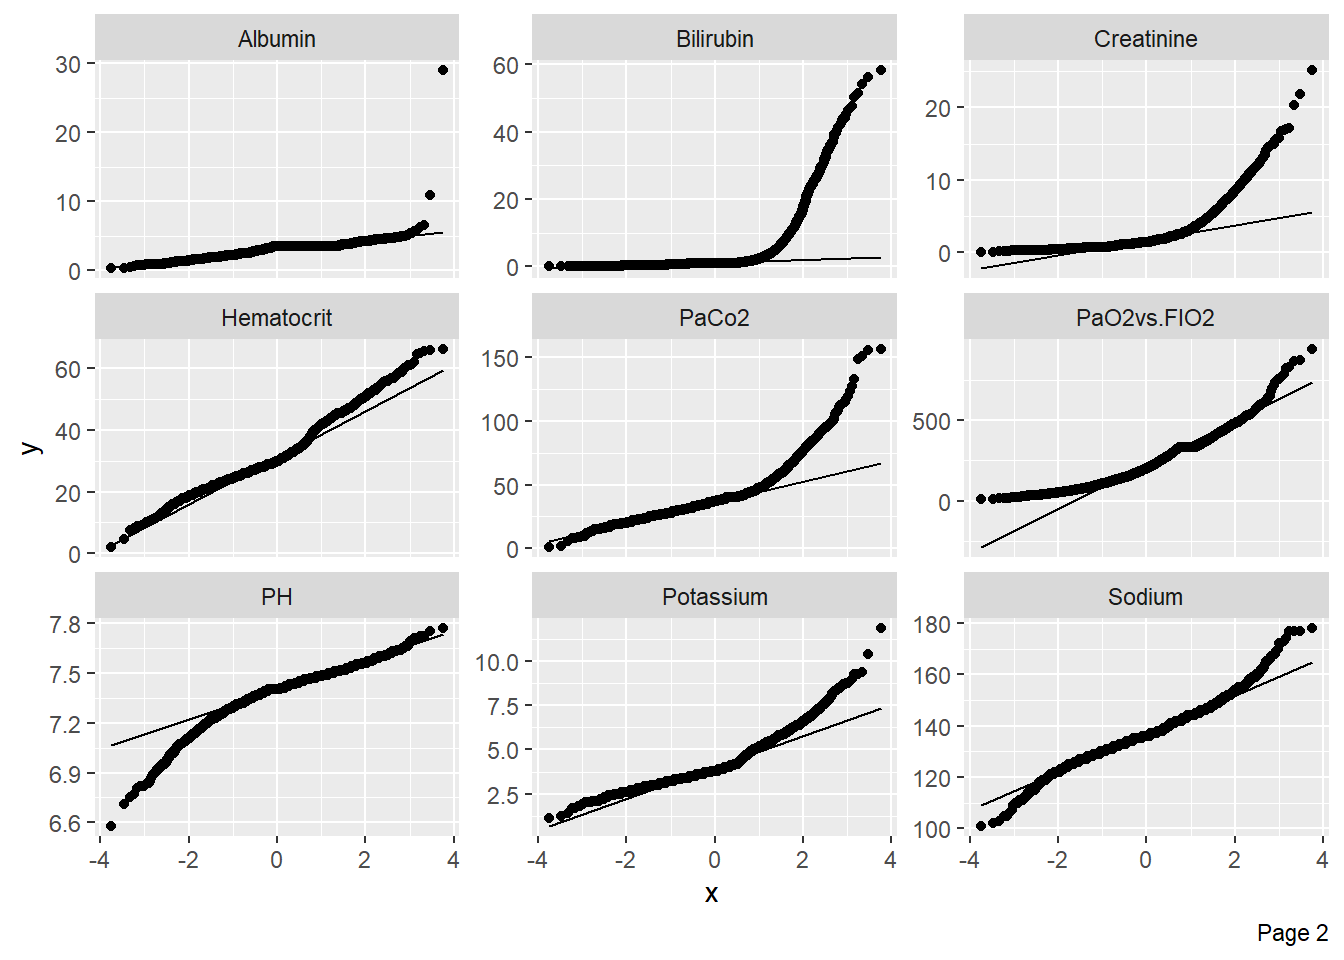
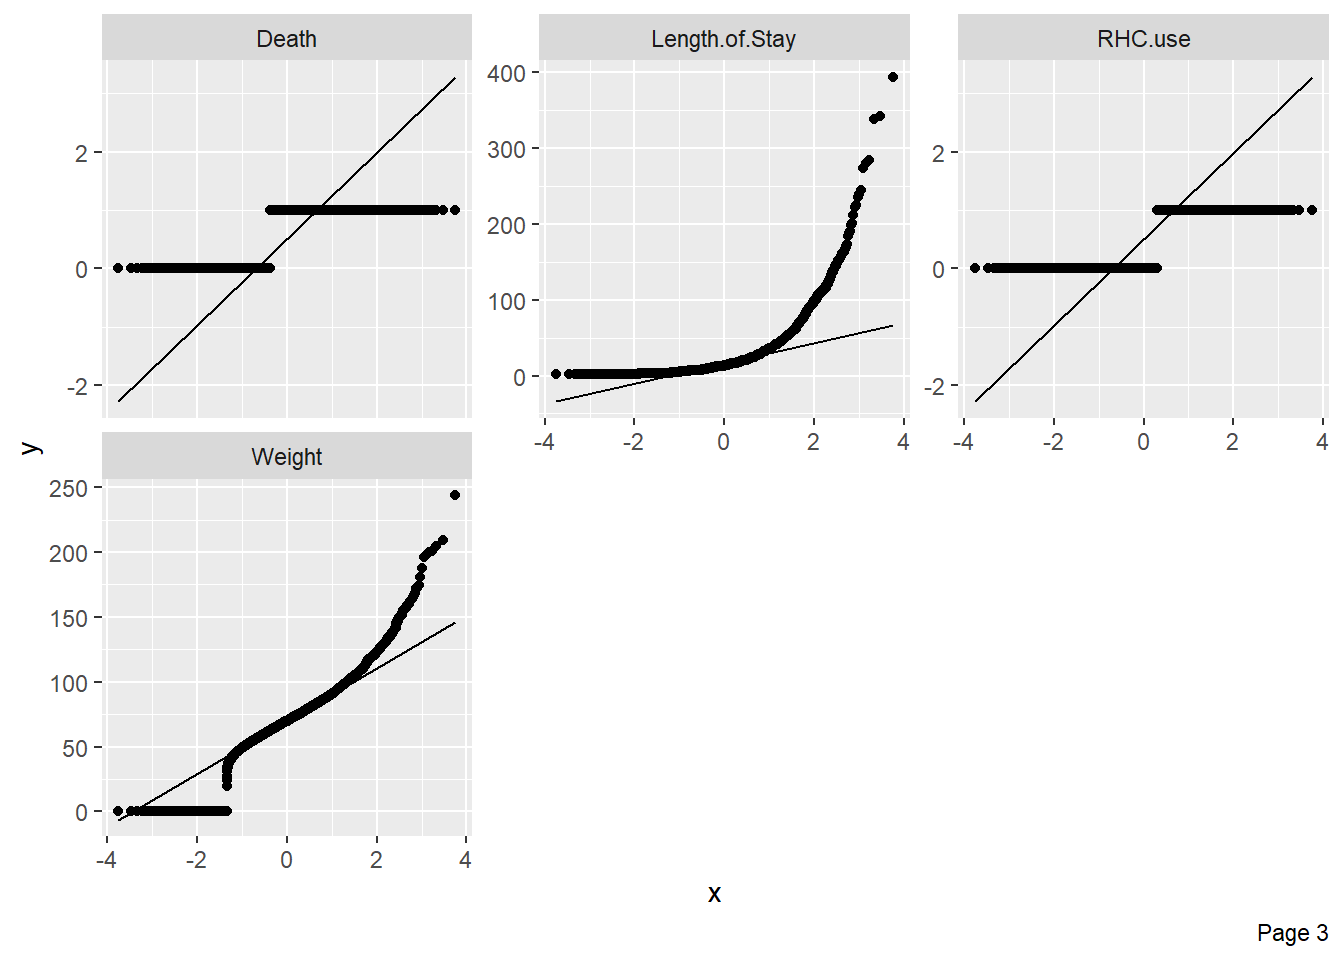
Quantile-quantile plots can be used to assess whether numerical variables are normally distributed:
Generate a correlation plot to show relationships between variables:
plot_correlation(ObsData)
#> Registered S3 method overwritten by 'plyr':
#>   method    from
#>   [.indexed table1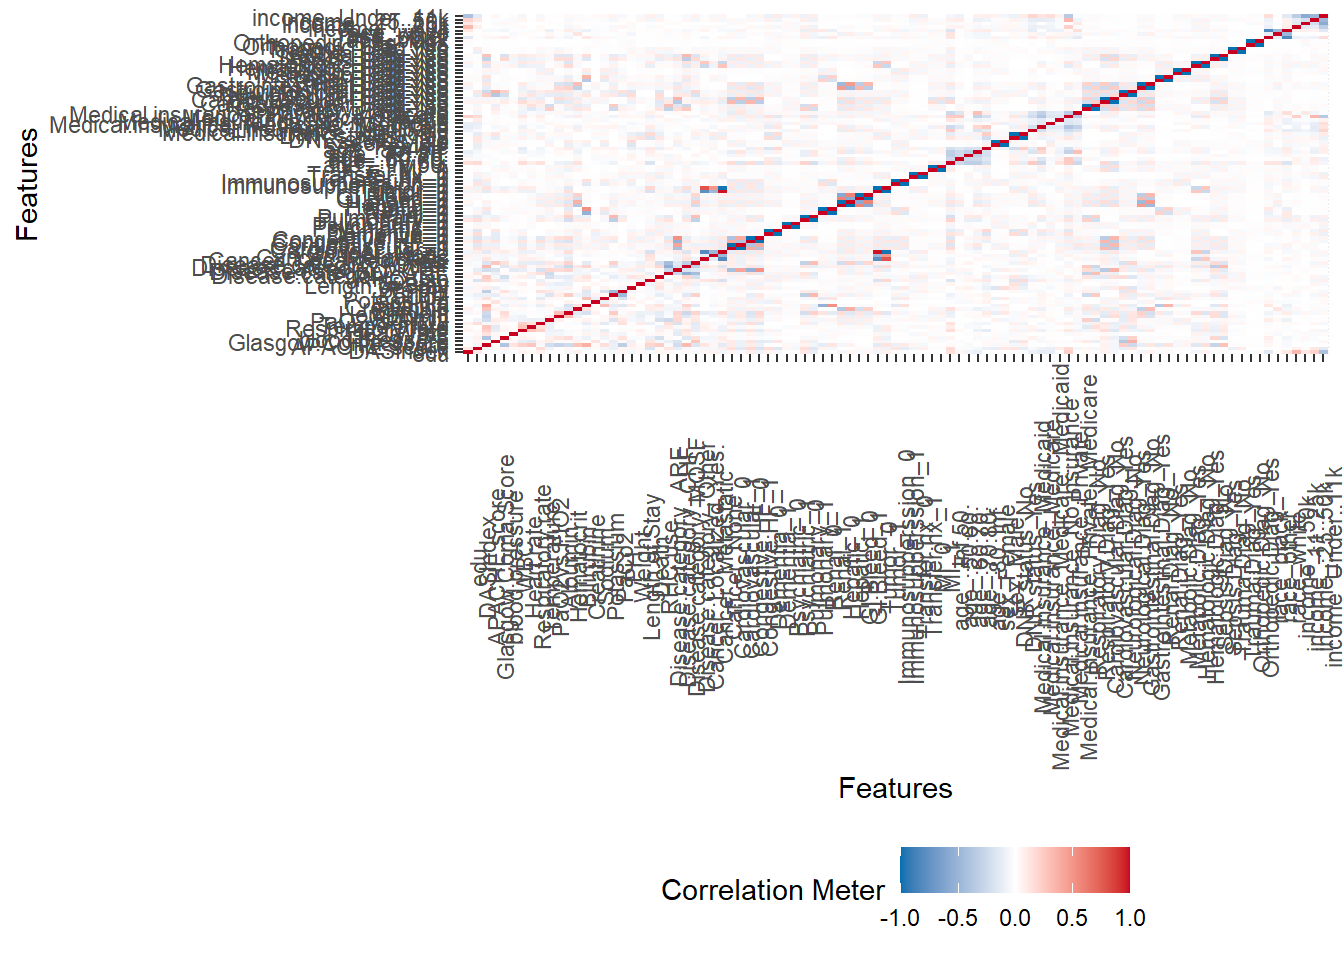
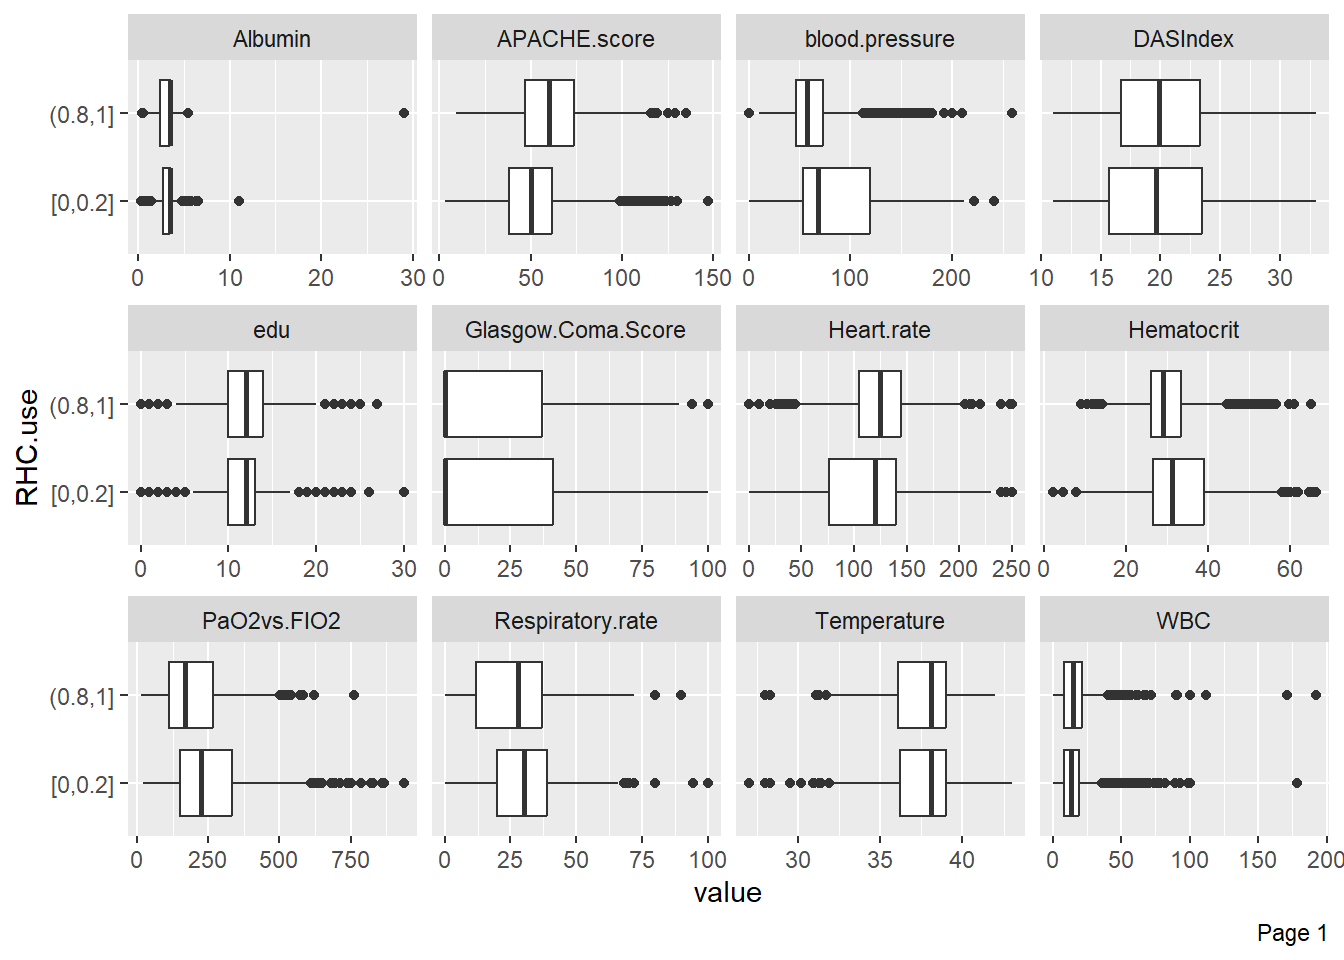
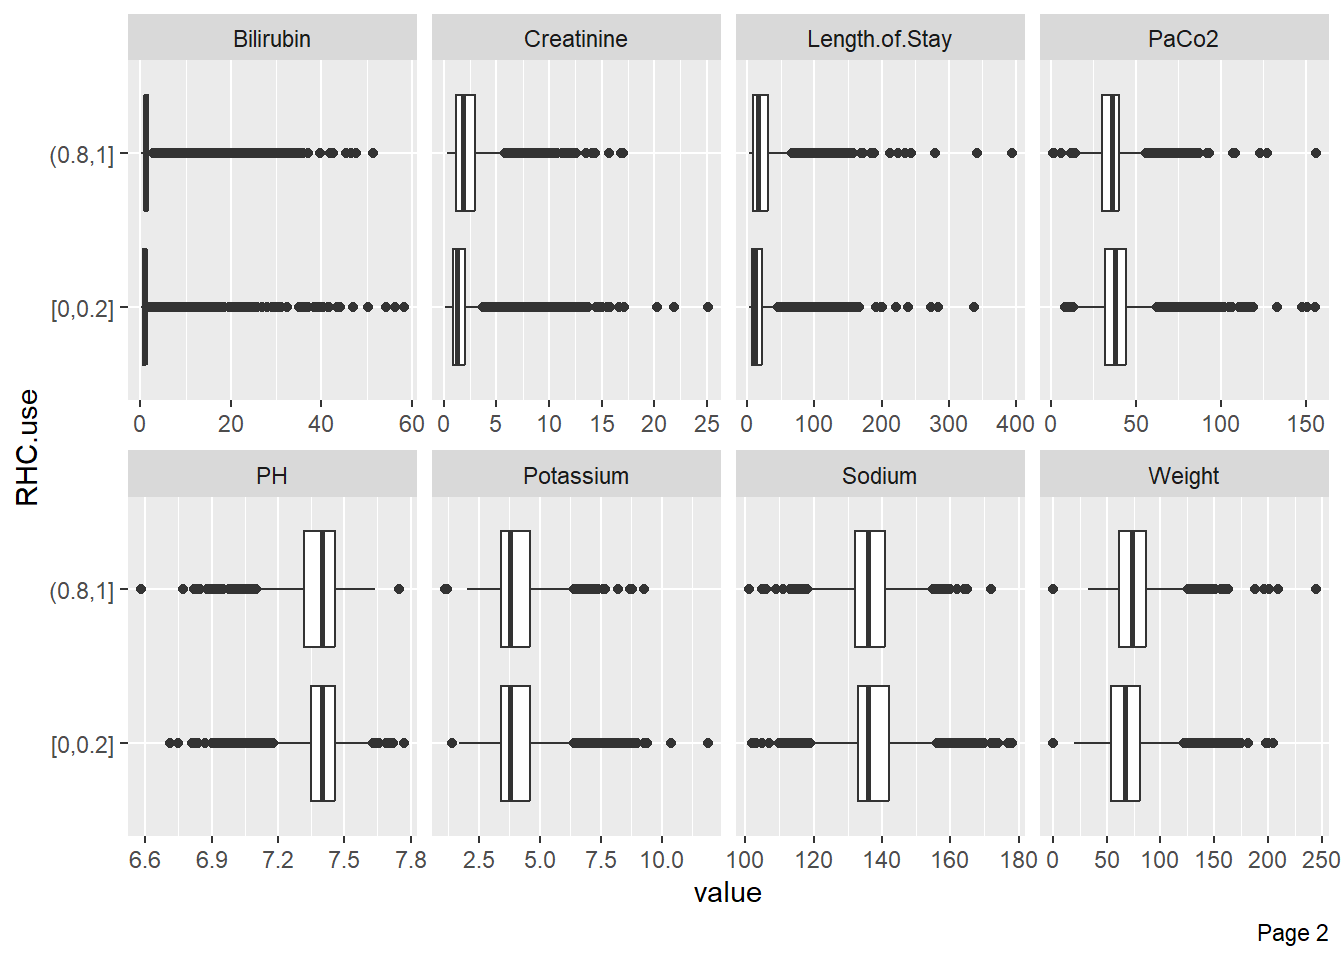
Boxplots can visualize variable distributions based on treatment or outcome:
Automatically generate a full PDF report with the create_report function:
GGally
GGally provides methods to combine multiple ggplot2 plots, enabling visualization of several variables at once.
ggpairs(ObsData,
        columns = c('age', 'sex', 'edu', 'blood.pressure', 'Medical.insurance'),
        ggplot2::aes(color=as.factor(RHC.use)))
#> `stat_bin()` using `bins = 30`. Pick better value `binwidth`.
#> `stat_bin()` using `bins = 30`. Pick better value `binwidth`.
#> `stat_bin()` using `bins = 30`. Pick better value `binwidth`.
#> `stat_bin()` using `bins = 30`. Pick better value `binwidth`.
#> `stat_bin()` using `bins = 30`. Pick better value `binwidth`.
#> `stat_bin()` using `bins = 30`. Pick better value `binwidth`.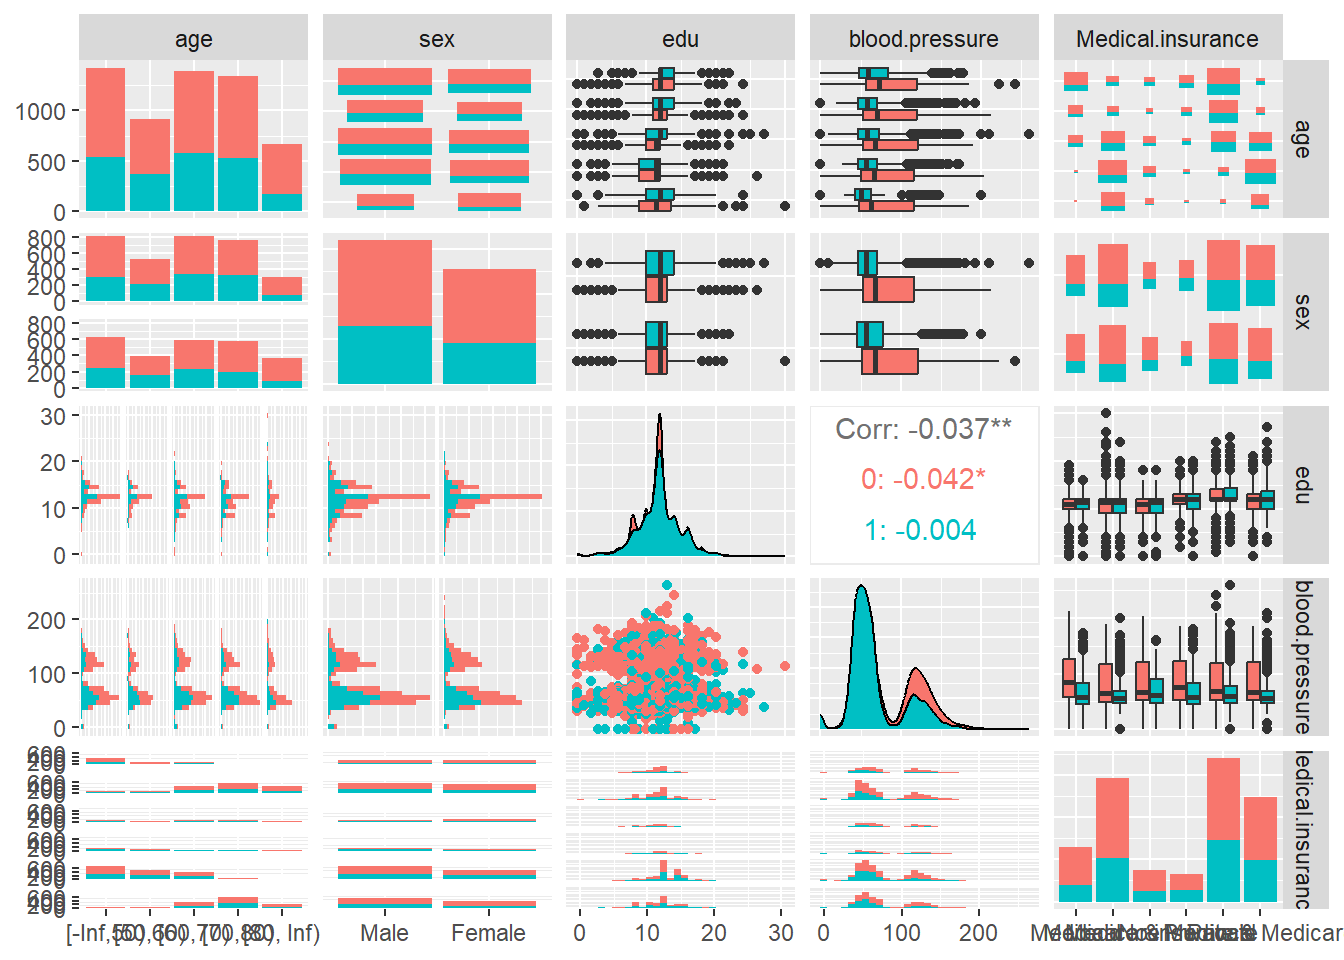
modelsummary
modelsummary provides functions to visualize data, including summaries, correlations, and Table 1-style tables.
Overview of each variable:
| Unique | Missing Pct. | Mean | SD | Min | Median | Max | Histogram | |
|---|---|---|---|---|---|---|---|---|
| edu | 42 | 0 | 11.7 | 3.1 | 0.0 | 12.0 | 30.0 |  |
| DASIndex | 1023 | 0 | 20.5 | 5.3 | 11.0 | 19.7 | 33.0 |  |
| APACHE.score | 123 | 0 | 54.7 | 20.0 | 3.0 | 54.0 | 147.0 |  |
| Glasgow.Coma.Score | 11 | 0 | 21.0 | 30.3 | 0.0 | 0.0 | 100.0 |  |
| blood.pressure | 178 | 0 | 78.5 | 38.0 | 0.0 | 63.0 | 259.0 |  |
| WBC | 520 | 0 | 15.6 | 11.9 | 0.0 | 14.1 | 192.0 |  |
| Heart.rate | 189 | 0 | 115.2 | 41.2 | 0.0 | 124.0 | 250.0 |  |
| Respiratory.rate | 72 | 0 | 28.1 | 14.1 | 0.0 | 30.0 | 100.0 |  |
| Temperature | 118 | 0 | 37.6 | 1.8 | 27.0 | 38.1 | 43.0 |  |
| PaO2vs.FIO2 | 1342 | 0 | 222.3 | 115.0 | 11.6 | 202.5 | 937.5 |  |
| Albumin | 57 | 0 | 3.1 | 0.8 | 0.3 | 3.5 | 29.0 |  |
| Hematocrit | 450 | 0 | 31.9 | 8.4 | 2.0 | 30.0 | 66.2 |  |
| Bilirubin | 266 | 0 | 2.3 | 4.8 | 0.1 | 1.0 | 58.2 |  |
| Creatinine | 148 | 0 | 2.1 | 2.1 | 0.1 | 1.5 | 25.1 |  |
| Sodium | 73 | 0 | 136.8 | 7.7 | 101.0 | 136.0 | 178.0 |  |
| Potassium | 81 | 0 | 4.1 | 1.0 | 1.1 | 3.8 | 11.9 |  |
| PaCo2 | 266 | 0 | 38.7 | 13.2 | 1.0 | 37.0 | 156.0 |  |
| PH | 96 | 0 | 7.4 | 0.1 | 6.6 | 7.4 | 7.8 |  |
| Weight | 922 | 0 | 67.8 | 29.1 | 0.0 | 70.0 | 244.0 |  |
| Length.of.Stay | 164 | 0 | 21.6 | 25.9 | 2.0 | 14.0 | 394.0 |  |
| Death | 2 | 0 | 0.6 | 0.5 | 0.0 | 1.0 | 1.0 |  |
| RHC.use | 2 | 0 | 0.4 | 0.5 | 0.0 | 0.0 | 1.0 |  |
| N | % | |||||||
| Disease.category | ARF | 2490 | 43.4 | |||||
| CHF | 456 | 8.0 | ||||||
| Other | 1163 | 20.3 | ||||||
| MOSF | 1626 | 28.4 | ||||||
| Cancer | None | 4379 | 76.4 | |||||
| Localized (Yes) | 972 | 16.9 | ||||||
| Metastatic | 384 | 6.7 | ||||||
| Cardiovascular | 0 | 4722 | 82.3 | |||||
| 1 | 1013 | 17.7 | ||||||
| Congestive.HF | 0 | 4714 | 82.2 | |||||
| 1 | 1021 | 17.8 | ||||||
| Dementia | 0 | 5171 | 90.2 | |||||
| 1 | 564 | 9.8 | ||||||
| Psychiatric | 0 | 5349 | 93.3 | |||||
| 1 | 386 | 6.7 | ||||||
| Pulmonary | 0 | 4646 | 81.0 | |||||
| 1 | 1089 | 19.0 | ||||||
| Renal | 0 | 5480 | 95.6 | |||||
| 1 | 255 | 4.4 | ||||||
| Hepatic | 0 | 5334 | 93.0 | |||||
| 1 | 401 | 7.0 | ||||||
| GI.Bleed | 0 | 5550 | 96.8 | |||||
| 1 | 185 | 3.2 | ||||||
| Tumor | 0 | 4419 | 77.1 | |||||
| 1 | 1316 | 22.9 | ||||||
| Immunosupperssion | 0 | 4192 | 73.1 | |||||
| 1 | 1543 | 26.9 | ||||||
| Transfer.hx | 0 | 5073 | 88.5 | |||||
| 1 | 662 | 11.5 | ||||||
| MI | 0 | 5535 | 96.5 | |||||
| 1 | 200 | 3.5 | ||||||
| age | [-Inf,50) | 1424 | 24.8 | |||||
| [50,60) | 917 | 16.0 | ||||||
| [60,70) | 1389 | 24.2 | ||||||
| [70,80) | 1338 | 23.3 | ||||||
| [80, Inf) | 667 | 11.6 | ||||||
| sex | Male | 3192 | 55.7 | |||||
| Female | 2543 | 44.3 | ||||||
| DNR.status | No | 5081 | 88.6 | |||||
| Yes | 654 | 11.4 | ||||||
| Medical.insurance | Medicaid | 647 | 11.3 | |||||
| Medicare | 1458 | 25.4 | ||||||
| Medicare & Medicaid | 374 | 6.5 | ||||||
| No insurance | 322 | 5.6 | ||||||
| Private | 1698 | 29.6 | ||||||
| Private & Medicare | 1236 | 21.6 | ||||||
| Respiratory.Diag | No | 3622 | 63.2 | |||||
| Yes | 2113 | 36.8 | ||||||
| Cardiovascular.Diag | No | 3804 | 66.3 | |||||
| Yes | 1931 | 33.7 | ||||||
| Neurological.Diag | No | 5042 | 87.9 | |||||
| Yes | 693 | 12.1 | ||||||
| Gastrointestinal.Diag | No | 4793 | 83.6 | |||||
| Yes | 942 | 16.4 | ||||||
| Renal.Diag | No | 5440 | 94.9 | |||||
| Yes | 295 | 5.1 | ||||||
| Metabolic.Diag | No | 5470 | 95.4 | |||||
| Yes | 265 | 4.6 | ||||||
| Hematologic.Diag | No | 5381 | 93.8 | |||||
| Yes | 354 | 6.2 | ||||||
| Sepsis.Diag | No | 4704 | 82.0 | |||||
| Yes | 1031 | 18.0 | ||||||
| Trauma.Diag | No | 5683 | 99.1 | |||||
| Yes | 52 | 0.9 | ||||||
| Orthopedic.Diag | No | 5728 | 99.9 | |||||
| Yes | 7 | 0.1 | ||||||
| race | white | 4460 | 77.8 | |||||
| black | 920 | 16.0 | ||||||
| other | 355 | 6.2 | ||||||
| income | $11-$25k | 1165 | 20.3 | |||||
| $25-$50k | 893 | 15.6 | ||||||
| > $50k | 451 | 7.9 | ||||||
| Under $11k | 3226 | 56.3 |
Create a Table 1 using datasummary_balance:
| 0 | 1 | ||||
|---|---|---|---|---|---|
| Mean | Std. Dev. | Mean | Std. Dev. | ||
| edu | 11.6 | 3.1 | 11.9 | 3.2 | |
| DASIndex | 20.4 | 5.5 | 20.7 | 5.0 | |
| APACHE.score | 50.9 | 18.8 | 60.7 | 20.3 | |
| Glasgow.Coma.Score | 22.3 | 31.4 | 19.0 | 28.3 | |
| blood.pressure | 84.9 | 38.9 | 68.2 | 34.2 | |
| WBC | 15.3 | 11.4 | 16.3 | 12.5 | |
| Heart.rate | 112.9 | 40.9 | 118.9 | 41.5 | |
| Respiratory.rate | 29.0 | 13.9 | 26.7 | 14.2 | |
| Temperature | 37.6 | 1.7 | 37.6 | 1.8 | |
| PaO2vs.FIO2 | 240.6 | 116.7 | 192.4 | 105.5 | |
| Albumin | 3.2 | 0.7 | 3.0 | 0.9 | |
| Hematocrit | 32.7 | 8.8 | 30.5 | 7.4 | |
| Bilirubin | 2.0 | 4.4 | 2.7 | 5.3 | |
| Creatinine | 1.9 | 2.0 | 2.5 | 2.1 | |
| Sodium | 137.0 | 7.7 | 136.3 | 7.6 | |
| Potassium | 4.1 | 1.0 | 4.0 | 1.0 | |
| PaCo2 | 40.0 | 14.2 | 36.8 | 11.0 | |
| PH | 7.4 | 0.1 | 7.4 | 0.1 | |
| Weight | 65.0 | 29.5 | 72.4 | 27.7 | |
| Length.of.Stay | 19.5 | 23.6 | 24.9 | 28.9 | |
| Death | 0.6 | 0.5 | 0.7 | 0.5 | |
| N | Pct. | N | Pct. | ||
| Disease.category | ARF | 1581 | 44.5 | 909 | 41.6 |
| CHF | 247 | 7.0 | 209 | 9.6 | |
| Other | 955 | 26.9 | 208 | 9.5 | |
| MOSF | 768 | 21.6 | 858 | 39.3 | |
| Cancer | None | 2652 | 74.7 | 1727 | 79.1 |
| Localized (Yes) | 638 | 18.0 | 334 | 15.3 | |
| Metastatic | 261 | 7.4 | 123 | 5.6 | |
| Cardiovascular | 0 | 2984 | 84.0 | 1738 | 79.6 |
| 1 | 567 | 16.0 | 446 | 20.4 | |
| Congestive.HF | 0 | 2955 | 83.2 | 1759 | 80.5 |
| 1 | 596 | 16.8 | 425 | 19.5 | |
| Dementia | 0 | 3138 | 88.4 | 2033 | 93.1 |
| 1 | 413 | 11.6 | 151 | 6.9 | |
| Psychiatric | 0 | 3265 | 91.9 | 2084 | 95.4 |
| 1 | 286 | 8.1 | 100 | 4.6 | |
| Pulmonary | 0 | 2777 | 78.2 | 1869 | 85.6 |
| 1 | 774 | 21.8 | 315 | 14.4 | |
| Renal | 0 | 3402 | 95.8 | 2078 | 95.1 |
| 1 | 149 | 4.2 | 106 | 4.9 | |
| Hepatic | 0 | 3286 | 92.5 | 2048 | 93.8 |
| 1 | 265 | 7.5 | 136 | 6.2 | |
| GI.Bleed | 0 | 3420 | 96.3 | 2130 | 97.5 |
| 1 | 131 | 3.7 | 54 | 2.5 | |
| Tumor | 0 | 2679 | 75.4 | 1740 | 79.7 |
| 1 | 872 | 24.6 | 444 | 20.3 | |
| Immunosupperssion | 0 | 2644 | 74.5 | 1548 | 70.9 |
| 1 | 907 | 25.5 | 636 | 29.1 | |
| Transfer.hx | 0 | 3216 | 90.6 | 1857 | 85.0 |
| 1 | 335 | 9.4 | 327 | 15.0 | |
| MI | 0 | 3446 | 97.0 | 2089 | 95.7 |
| 1 | 105 | 3.0 | 95 | 4.3 | |
| age | [-Inf,50) | 884 | 24.9 | 540 | 24.7 |
| [50,60) | 546 | 15.4 | 371 | 17.0 | |
| [60,70) | 812 | 22.9 | 577 | 26.4 | |
| [70,80) | 809 | 22.8 | 529 | 24.2 | |
| [80, Inf) | 500 | 14.1 | 167 | 7.6 | |
| sex | Male | 1914 | 53.9 | 1278 | 58.5 |
| Female | 1637 | 46.1 | 906 | 41.5 | |
| DNR.status | No | 3052 | 85.9 | 2029 | 92.9 |
| Yes | 499 | 14.1 | 155 | 7.1 | |
| Medical.insurance | Medicaid | 454 | 12.8 | 193 | 8.8 |
| Medicare | 947 | 26.7 | 511 | 23.4 | |
| Medicare & Medicaid | 251 | 7.1 | 123 | 5.6 | |
| No insurance | 186 | 5.2 | 136 | 6.2 | |
| Private | 967 | 27.2 | 731 | 33.5 | |
| Private & Medicare | 746 | 21.0 | 490 | 22.4 | |
| Respiratory.Diag | No | 2070 | 58.3 | 1552 | 71.1 |
| Yes | 1481 | 41.7 | 632 | 28.9 | |
| Cardiovascular.Diag | No | 2544 | 71.6 | 1260 | 57.7 |
| Yes | 1007 | 28.4 | 924 | 42.3 | |
| Neurological.Diag | No | 2976 | 83.8 | 2066 | 94.6 |
| Yes | 575 | 16.2 | 118 | 5.4 | |
| Gastrointestinal.Diag | No | 3029 | 85.3 | 1764 | 80.8 |
| Yes | 522 | 14.7 | 420 | 19.2 | |
| Renal.Diag | No | 3404 | 95.9 | 2036 | 93.2 |
| Yes | 147 | 4.1 | 148 | 6.8 | |
| Metabolic.Diag | No | 3379 | 95.2 | 2091 | 95.7 |
| Yes | 172 | 4.8 | 93 | 4.3 | |
| Hematologic.Diag | No | 3312 | 93.3 | 2069 | 94.7 |
| Yes | 239 | 6.7 | 115 | 5.3 | |
| Sepsis.Diag | No | 3036 | 85.5 | 1668 | 76.4 |
| Yes | 515 | 14.5 | 516 | 23.6 | |
| Trauma.Diag | No | 3533 | 99.5 | 2150 | 98.4 |
| Yes | 18 | 0.5 | 34 | 1.6 | |
| Orthopedic.Diag | No | 3548 | 99.9 | 2180 | 99.8 |
| Yes | 3 | 0.1 | 4 | 0.2 | |
| race | white | 2753 | 77.5 | 1707 | 78.2 |
| black | 585 | 16.5 | 335 | 15.3 | |
| other | 213 | 6.0 | 142 | 6.5 | |
| income | $11-$25k | 713 | 20.1 | 452 | 20.7 |
| $25-$50k | 500 | 14.1 | 393 | 18.0 | |
| > $50k | 257 | 7.2 | 194 | 8.9 | |
| Under $11k | 2081 | 58.6 | 1145 | 52.4 | |
You can also customize the appearance of tables generated with modelsummary. For example, you can adjust the number of digits displayed in the summaries.
datasummary_balance(~ RHC.use, ObsData,
                    fmt="%.2f",
                    output="markdown")
#> Warning: Please install the `estimatr` package or set `dinm=FALSE` to suppress
#> this warning.| 0 | 1 | ||||
|---|---|---|---|---|---|
| Mean | Mean | Std. Dev. | |||
| edu | 11.57 | 3.13 | 11.86 | 3.16 | |
| DASIndex | 20.37 | 5.48 | 20.70 | 5.03 | |
| APACHE.score | 50.93 | 18.81 | 60.74 | 20.27 | |
| Glasgow.Coma.Score | 22.25 | 31.37 | 18.97 | 28.26 | |
| blood.pressure | 84.87 | 38.87 | 68.20 | 34.24 | |
| WBC | 15.26 | 11.41 | 16.27 | 12.55 | |
| Heart.rate | 112.87 | 40.94 | 118.93 | 41.47 | |
| Respiratory.rate | 28.98 | 13.95 | 26.65 | 14.17 | |
| Temperature | 37.63 | 1.74 | 37.59 | 1.83 | |
| PaO2vs.FIO2 | 240.63 | 116.66 | 192.43 | 105.54 | |
| Albumin | 3.16 | 0.67 | 2.98 | 0.93 | |
| Hematocrit | 32.70 | 8.79 | 30.51 | 7.42 | |
| Bilirubin | 2.00 | 4.43 | 2.71 | 5.33 | |
| Creatinine | 1.92 | 2.03 | 2.47 | 2.05 | |
| Sodium | 137.04 | 7.68 | 136.33 | 7.60 | |
| Potassium | 4.08 | 1.04 | 4.05 | 1.01 | |
| PaCo2 | 39.95 | 14.24 | 36.79 | 10.97 | |
| PH | 7.39 | 0.11 | 7.38 | 0.11 | |
| Weight | 65.04 | 29.50 | 72.36 | 27.73 | |
| Length.of.Stay | 19.53 | 23.59 | 24.86 | 28.90 | |
| Death | 0.63 | 0.48 | 0.68 | 0.47 | |
| N | Pct. | N | Pct. | ||
| Disease.category | ARF | 1581 | 44.5 | 909 | 41.6 |
| CHF | 247 | 7.0 | 209 | 9.6 | |
| Other | 955 | 26.9 | 208 | 9.5 | |
| MOSF | 768 | 21.6 | 858 | 39.3 | |
| Cancer | None | 2652 | 74.7 | 1727 | 79.1 |
| Localized (Yes) | 638 | 18.0 | 334 | 15.3 | |
| Metastatic | 261 | 7.4 | 123 | 5.6 | |
| Cardiovascular | 0 | 2984 | 84.0 | 1738 | 79.6 |
| 1 | 567 | 16.0 | 446 | 20.4 | |
| Congestive.HF | 0 | 2955 | 83.2 | 1759 | 80.5 |
| 1 | 596 | 16.8 | 425 | 19.5 | |
| Dementia | 0 | 3138 | 88.4 | 2033 | 93.1 |
| 1 | 413 | 11.6 | 151 | 6.9 | |
| Psychiatric | 0 | 3265 | 91.9 | 2084 | 95.4 |
| 1 | 286 | 8.1 | 100 | 4.6 | |
| Pulmonary | 0 | 2777 | 78.2 | 1869 | 85.6 |
| 1 | 774 | 21.8 | 315 | 14.4 | |
| Renal | 0 | 3402 | 95.8 | 2078 | 95.1 |
| 1 | 149 | 4.2 | 106 | 4.9 | |
| Hepatic | 0 | 3286 | 92.5 | 2048 | 93.8 |
| 1 | 265 | 7.5 | 136 | 6.2 | |
| GI.Bleed | 0 | 3420 | 96.3 | 2130 | 97.5 |
| 1 | 131 | 3.7 | 54 | 2.5 | |
| Tumor | 0 | 2679 | 75.4 | 1740 | 79.7 |
| 1 | 872 | 24.6 | 444 | 20.3 | |
| Immunosupperssion | 0 | 2644 | 74.5 | 1548 | 70.9 |
| 1 | 907 | 25.5 | 636 | 29.1 | |
| Transfer.hx | 0 | 3216 | 90.6 | 1857 | 85.0 |
| 1 | 335 | 9.4 | 327 | 15.0 | |
| MI | 0 | 3446 | 97.0 | 2089 | 95.7 |
| 1 | 105 | 3.0 | 95 | 4.3 | |
| age | [-Inf,50) | 884 | 24.9 | 540 | 24.7 |
| [50,60) | 546 | 15.4 | 371 | 17.0 | |
| [60,70) | 812 | 22.9 | 577 | 26.4 | |
| [70,80) | 809 | 22.8 | 529 | 24.2 | |
| [80, Inf) | 500 | 14.1 | 167 | 7.6 | |
| sex | Male | 1914 | 53.9 | 1278 | 58.5 |
| Female | 1637 | 46.1 | 906 | 41.5 | |
| DNR.status | No | 3052 | 85.9 | 2029 | 92.9 |
| Yes | 499 | 14.1 | 155 | 7.1 | |
| Medical.insurance | Medicaid | 454 | 12.8 | 193 | 8.8 |
| Medicare | 947 | 26.7 | 511 | 23.4 | |
| Medicare & Medicaid | 251 | 7.1 | 123 | 5.6 | |
| No insurance | 186 | 5.2 | 136 | 6.2 | |
| Private | 967 | 27.2 | 731 | 33.5 | |
| Private & Medicare | 746 | 21.0 | 490 | 22.4 | |
| Respiratory.Diag | No | 2070 | 58.3 | 1552 | 71.1 |
| Yes | 1481 | 41.7 | 632 | 28.9 | |
| Cardiovascular.Diag | No | 2544 | 71.6 | 1260 | 57.7 |
| Yes | 1007 | 28.4 | 924 | 42.3 | |
| Neurological.Diag | No | 2976 | 83.8 | 2066 | 94.6 |
| Yes | 575 | 16.2 | 118 | 5.4 | |
| Gastrointestinal.Diag | No | 3029 | 85.3 | 1764 | 80.8 |
| Yes | 522 | 14.7 | 420 | 19.2 | |
| Renal.Diag | No | 3404 | 95.9 | 2036 | 93.2 |
| Yes | 147 | 4.1 | 148 | 6.8 | |
| Metabolic.Diag | No | 3379 | 95.2 | 2091 | 95.7 |
| Yes | 172 | 4.8 | 93 | 4.3 | |
| Hematologic.Diag | No | 3312 | 93.3 | 2069 | 94.7 |
| Yes | 239 | 6.7 | 115 | 5.3 | |
| Sepsis.Diag | No | 3036 | 85.5 | 1668 | 76.4 |
| Yes | 515 | 14.5 | 516 | 23.6 | |
| Trauma.Diag | No | 3533 | 99.5 | 2150 | 98.4 |
| Yes | 18 | 0.5 | 34 | 1.6 | |
| Orthopedic.Diag | No | 3548 | 99.9 | 2180 | 99.8 |
| Yes | 3 | 0.1 | 4 | 0.2 | |
| race | white | 2753 | 77.5 | 1707 | 78.2 |
| black | 585 | 16.5 | 335 | 15.3 | |
| other | 213 | 6.0 | 142 | 6.5 | |
| income | $11-$25k | 713 | 20.1 | 452 | 20.7 |
| $25-$50k | 500 | 14.1 | 393 | 18.0 | |
|
257 | 7.2 | 194 | 8.9 | |
| Under $11k | 2081 | 58.6 | 1145 | 52.4 | |
Extract correlations between variables with datasummary_correlation:
| edu | DASIndex | APACHE.score | Glasgow.Coma.Score | blood.pressure | WBC | Heart.rate | Respiratory.rate | Temperature | PaO2vs.FIO2 | Albumin | Hematocrit | Bilirubin | Creatinine | Sodium | Potassium | PaCo2 | PH | Weight | Length.of.Stay | Death | RHC.use | |
|---|---|---|---|---|---|---|---|---|---|---|---|---|---|---|---|---|---|---|---|---|---|---|
| edu | 1 | . | . | . | . | . | . | . | . | . | . | . | . | . | . | . | . | . | . | . | . | . |
| DASIndex | .10 | 1 | . | . | . | . | . | . | . | . | . | . | . | . | . | . | . | . | . | . | . | . |
| APACHE.score | .02 | -.06 | 1 | . | . | . | . | . | . | . | . | . | . | . | . | . | . | . | . | . | . | . |
| Glasgow.Coma.Score | -.02 | .04 | .03 | 1 | . | . | . | . | . | . | . | . | . | . | . | . | . | . | . | . | . | . |
| blood.pressure | -.04 | .06 | -.40 | .02 | 1 | . | . | . | . | . | . | . | . | . | . | . | . | . | . | . | . | . |
| WBC | -.02 | .03 | .13 | .04 | -.03 | 1 | . | . | . | . | . | . | . | . | . | . | . | . | . | . | . | . |
| Heart.rate | .05 | .02 | .22 | -.11 | .06 | .03 | 1 | . | . | . | . | . | . | . | . | . | . | . | . | . | . | . |
| Respiratory.rate | .03 | -.00 | .26 | -.14 | .03 | .01 | .28 | 1 | . | . | . | . | . | . | . | . | . | . | . | . | . | . |
| Temperature | .07 | .15 | -.04 | .05 | .01 | -.01 | .22 | .14 | 1 | . | . | . | . | . | . | . | . | . | . | . | . | . |
| PaO2vs.FIO2 | -.01 | -.07 | -.23 | .09 | .07 | -.06 | -.08 | -.10 | -.10 | 1 | . | . | . | . | . | . | . | . | . | . | . | . |
| Albumin | -.00 | -.00 | -.29 | .02 | .13 | -.06 | -.08 | .00 | -.01 | .07 | 1 | . | . | . | . | . | . | . | . | . | . | . |
| Hematocrit | -.05 | .03 | -.24 | .03 | .16 | -.03 | -.03 | .01 | -.02 | -.01 | .29 | 1 | . | . | . | . | . | . | . | . | . | . |
| Bilirubin | .07 | -.01 | .28 | .05 | -.05 | .01 | .03 | .01 | -.03 | .03 | -.09 | -.15 | 1 | . | . | . | . | . | . | . | . | . |
| Creatinine | -.02 | -.05 | .38 | .01 | -.09 | .05 | -.06 | -.04 | -.11 | .06 | -.00 | -.20 | .12 | 1 | . | . | . | . | . | . | . | . |
| Sodium | -.01 | .03 | .02 | .13 | .02 | -.04 | .03 | .02 | .05 | -.02 | .00 | .06 | .02 | -.01 | 1 | . | . | . | . | . | . | . |
| Potassium | -.02 | -.06 | .15 | -.01 | -.07 | .08 | -.11 | -.01 | -.13 | .04 | .03 | -.01 | .00 | .30 | -.10 | 1 | . | . | . | . | . | . |
| PaCo2 | -.05 | -.09 | -.09 | -.12 | .04 | -.05 | -.01 | .00 | -.04 | -.17 | .09 | .24 | -.08 | -.13 | .06 | .04 | 1 | . | . | . | . | . |
| PH | .04 | .05 | -.33 | .03 | .13 | -.06 | .03 | -.01 | .14 | .11 | .04 | -.03 | .02 | -.16 | -.02 | -.20 | -.47 | 1 | . | . | . | . |
| Weight | -.06 | .05 | .08 | -.08 | -.02 | -.01 | .02 | -.01 | .02 | -.05 | -.05 | .05 | .01 | .10 | -.00 | .06 | .03 | -.05 | 1 | . | . | . |
| Length.of.Stay | .02 | .04 | .02 | -.00 | -.02 | .03 | .07 | -.01 | .09 | -.08 | -.11 | -.09 | -.00 | .01 | .04 | -.02 | .00 | .02 | .02 | 1 | . | . |
| Death | -.03 | -.18 | .19 | .12 | -.10 | .03 | -.02 | .01 | -.10 | .02 | -.03 | -.09 | .08 | .08 | .00 | .05 | -.04 | -.04 | -.05 | -.08 | 1 | . |
| RHC.use | .04 | .03 | .24 | -.05 | -.21 | .04 | .07 | -.08 | -.01 | -.20 | -.12 | -.13 | .07 | .13 | -.04 | -.01 | -.12 | -.06 | .12 | .10 | .05 | 1 |
Generate a contingency table using datasummary_crosstab:
| age | 0 | 1 | All | |
|---|---|---|---|---|
| [-Inf,50) | N | 884 | 540 | 1424 |
| % row | 62.1 | 37.9 | 100.0 | |
| [50,60) | N | 546 | 371 | 917 |
| % row | 59.5 | 40.5 | 100.0 | |
| [60,70) | N | 812 | 577 | 1389 |
| % row | 58.5 | 41.5 | 100.0 | |
| [70,80) | N | 809 | 529 | 1338 |
| % row | 60.5 | 39.5 | 100.0 | |
| [80, Inf) | N | 500 | 167 | 667 |
| % row | 75.0 | 25.0 | 100.0 | |
| All | N | 3551 | 2184 | 5735 |
| % row | 61.9 | 38.1 | 100.0 |
The modelsummary package also allows for professional display of regression models, combining results from multiple models into one table for easy comparison.
# Example: Fit two regression models
model1 <- lm(Length.of.Stay ~ age + sex + APACHE.score, data = ObsData)
model2 <- lm(Length.of.Stay ~ age + sex + APACHE.score + Medical.insurance, data = ObsData)

# Display both models side by side
modelsummary(list(model1, model2),
             statistic = "p.value",
stars = TRUE)| (1) | (2) | |
|---|---|---|
| + p < 0.1, * p < 0.05, ** p < 0.01, *** p < 0.001 | ||
| (Intercept) | 21.312*** | 21.200*** |
| (<0.001) | (<0.001) | |
| age[50,60) | -1.065 | -1.116 |
| (0.330) | (0.310) | |
| age[60,70) | -1.420 | -1.201 |
| (0.145) | (0.255) | |
| age[70,80) | -2.763** | -2.334+ |
| (0.005) | (0.056) | |
| age[80, Inf) | -6.762*** | -6.530*** |
| (<0.001) | (<0.001) | |
| sexFemale | 0.932 | 1.021 |
| (0.176) | (0.140) | |
| APACHE.score | 0.033+ | 0.032+ |
| (0.057) | (0.063) | |
| Medical.insuranceMedicare | 0.561 | |
| (0.687) | ||
| Medical.insuranceMedicare & Medicaid | -2.545 | |
| (0.145) | ||
| Medical.insuranceNo insurance | 0.475 | |
| (0.788) | ||
| Medical.insurancePrivate | 0.385 | |
| (0.748) | ||
| Medical.insurancePrivate & Medicare | -0.817 | |
| (0.569) | ||
| Num.Obs. | 5735 | 5735 |
| R2 | 0.007 | 0.008 |
| R2 Adj. | 0.006 | 0.006 |
| AIC | 53563.6 | 53567.9 |
| BIC | 53616.8 | 53654.4 |
| Log.Lik. | -26773.805 | -26770.932 |
| F | 6.388 | 4.006 |
| RMSE | 25.78 | 25.77 |
All tables generated by modelsummary can be saved in various formats such as LaTeX, HTML, or Word.
stargazer
The stargazer package is widely used for outputting regression results in LaTeX, HTML, or plain text formats. It allows you to include various statistics, such as standard errors, t-values, p-values, and confidence intervals.
# Example: Fit two regression models
model1 <- lm(Length.of.Stay ~ age + sex + APACHE.score, data = ObsData)
model2 <- lm(Length.of.Stay ~ age + sex + APACHE.score + Medical.insurance, data = ObsData)

# Display the regression results using stargazer
stargazer(model1, model2, type = "text",
          title = "Regression Results",
          dep.var.labels = "Length of Stay",
          covariate.labels = c("Age", "Sex", "APACHE Score", "Medical Insurance"),
          out = "regression_table.txt")
#>
#> Regression Results
#> ==============================================================================
#>                                             Dependent variable:
#>                               ------------------------------------------------
#>                                                Length of Stay
#>                                         (1)                     (2)
#> ------------------------------------------------------------------------------
#> Age                                   -1.065                   -1.116
#>                                       (1.093)                 (1.099)
#>
#> Sex                                   -1.420                   -1.201
#>                                       (0.974)                 (1.055)
#>
#> APACHE Score                         -2.763***                -2.334*
#>                                       (0.982)                 (1.221)
#>
#> Medical Insurance                    -6.762***               -6.530***
#>                                       (1.213)                 (1.424)
#>
#> sexFemale                              0.932                   1.021
#>                                       (0.688)                 (0.691)
#>
#> APACHE.score                          0.033*                   0.032*
#>                                       (0.017)                 (0.017)
#>
#> Medical.insuranceMedicare                                      0.561
#>                                                               (1.391)
#>
#> Medical.insuranceMedicare            Medicaid
#>                                                               (1.744)
#>
#> Medical.insuranceNo insurance                                  0.475
#>                                                               (1.763)
#>
#> Medical.insurancePrivate                                       0.385
#>                                                               (1.199)
#>
#> Medical.insurancePrivate             Medicare
#>                                                               (1.436)
#>
#> Constant                             21.312***               21.200***
#>                                       (1.220)                 (1.495)
#>
#> ------------------------------------------------------------------------------
#> Observations                           5,735                   5,735
#> R2                                     0.007                   0.008
#> Adjusted R2                            0.006                   0.006
#> Residual Std. Error             25.795 (df = 5728)       25.793 (df = 5723)
#> F Statistic                   6.388*** (df = 6; 5728) 4.006*** (df = 11; 5723)
#> ==============================================================================
#> Note:                                              *p<0.1; **p<0.05; ***p<0.01
broom
The broom package converts regression model outputs into tidy data frames, making it easy to extract and manipulate specific parts of the model for custom summaries.
texreg
The texreg package allows you to export regression tables into LaTeX, HTML, or Word. It supports outputting multiple regression models side by side for easy comparison.
require(texreg)
#> Loading required package: texreg
#> Version:  1.39.4
#> Date:     2024-07-23
#> Author:   Philip Leifeld (University of Manchester)
#>
#> Consider submitting praise using the praise or praise_interactive functions.
#> Please cite the JSS article in your publications -- see citation("texreg").You can also customize the output from these packages by specifying different statistics to display, such as including robust standard errors, changing the number of decimal places, or adding significance stars.
stargazer(model1, model2, type = "text",
          se = list(coef(summary(model1))[ , "Std. Error"],
                    coef(summary(model2))[ , "Std. Error"]),
          star.cutoffs = c(0.05, 0.01, 0.001))
#>
#> ==============================================================================
#>                                             Dependent variable:
#>                               ------------------------------------------------
#>                                                Length.of.Stay
#>                                         (1)                     (2)
#> ------------------------------------------------------------------------------
#> age[50,60)                            -1.065                   -1.116
#>                                       (1.093)                 (1.099)
#>
#> age[60,70)                            -1.420                   -1.201
#>                                       (0.974)                 (1.055)
#>
#> age[70,80)                           -2.763**                  -2.334
#>                                       (0.982)                 (1.221)
#>
#> age[80, Inf)                         -6.762***               -6.530***
#>                                       (1.213)                 (1.424)
#>
#> sexFemale                              0.932                   1.021
#>                                       (0.688)                 (0.691)
#>
#> APACHE.score                           0.033                   0.032
#>                                       (0.017)                 (0.017)
#>
#> Medical.insuranceMedicare                                      0.561
#>                                                               (1.391)
#>
#> Medical.insuranceMedicare            Medicaid
#>                                                               (1.744)
#>
#> Medical.insuranceNo insurance                                  0.475
#>                                                               (1.763)
#>
#> Medical.insurancePrivate                                       0.385
#>                                                               (1.199)
#>
#> Medical.insurancePrivate             Medicare
#>                                                               (1.436)
#>
#> Constant                             21.312***               21.200***
#>                                       (1.220)                 (1.495)
#>
#> ------------------------------------------------------------------------------
#> Observations                           5,735                   5,735
#> R2                                     0.007                   0.008
#> Adjusted R2                            0.006                   0.006
#> Residual Std. Error             25.795 (df = 5728)       25.793 (df = 5723)
#> F Statistic                   6.388*** (df = 6; 5728) 4.006*** (df = 11; 5723)
#> ==============================================================================
#> Note:                                            *p<0.05; **p<0.01; ***p<0.001
janitor
The janitor package simplifies data cleaning tasks, such as checking for duplicate records, cleaning column names, and generating cross-tabulations.
skimr
The skimr package provides a more compact and readable summary compared to the default summary() function. It tailors its output for each variable type.
| Name | ObsData |
| Number of rows | 5735 |
| Number of columns | 52 |
| _______________________ | |
| Column type frequency: | |
| factor | 30 |
| numeric | 22 |
| ________________________ | |
| Group variables | None |
Variable type: factor
| skim_variable | n_missing | complete_rate | ordered | n_unique | top_counts |
|---|---|---|---|---|---|
| Disease.category | 0 | 1 | FALSE | 4 | ARF: 2490, MOS: 1626, Oth: 1163, CHF: 456 |
| Cancer | 0 | 1 | FALSE | 3 | Non: 4379, Loc: 972, Met: 384 |
| Cardiovascular | 0 | 1 | FALSE | 2 | 0: 4722, 1: 1013 |
| Congestive.HF | 0 | 1 | FALSE | 2 | 0: 4714, 1: 1021 |
| Dementia | 0 | 1 | FALSE | 2 | 0: 5171, 1: 564 |
| Psychiatric | 0 | 1 | FALSE | 2 | 0: 5349, 1: 386 |
| Pulmonary | 0 | 1 | FALSE | 2 | 0: 4646, 1: 1089 |
| Renal | 0 | 1 | FALSE | 2 | 0: 5480, 1: 255 |
| Hepatic | 0 | 1 | FALSE | 2 | 0: 5334, 1: 401 |
| GI.Bleed | 0 | 1 | FALSE | 2 | 0: 5550, 1: 185 |
| Tumor | 0 | 1 | FALSE | 2 | 0: 4419, 1: 1316 |
| Immunosupperssion | 0 | 1 | FALSE | 2 | 0: 4192, 1: 1543 |
| Transfer.hx | 0 | 1 | FALSE | 2 | 0: 5073, 1: 662 |
| MI | 0 | 1 | FALSE | 2 | 0: 5535, 1: 200 |
| age | 0 | 1 | FALSE | 5 | [-I: 1424, [60: 1389, [70: 1338, [50: 917 |
| sex | 0 | 1 | FALSE | 2 | Mal: 3192, Fem: 2543 |
| DNR.status | 0 | 1 | FALSE | 2 | No: 5081, Yes: 654 |
| Medical.insurance | 0 | 1 | FALSE | 6 | Pri: 1698, Med: 1458, Pri: 1236, Med: 647 |
| Respiratory.Diag | 0 | 1 | FALSE | 2 | No: 3622, Yes: 2113 |
| Cardiovascular.Diag | 0 | 1 | FALSE | 2 | No: 3804, Yes: 1931 |
| Neurological.Diag | 0 | 1 | FALSE | 2 | No: 5042, Yes: 693 |
| Gastrointestinal.Diag | 0 | 1 | FALSE | 2 | No: 4793, Yes: 942 |
| Renal.Diag | 0 | 1 | FALSE | 2 | No: 5440, Yes: 295 |
| Metabolic.Diag | 0 | 1 | FALSE | 2 | No: 5470, Yes: 265 |
| Hematologic.Diag | 0 | 1 | FALSE | 2 | No: 5381, Yes: 354 |
| Sepsis.Diag | 0 | 1 | FALSE | 2 | No: 4704, Yes: 1031 |
| Trauma.Diag | 0 | 1 | FALSE | 2 | No: 5683, Yes: 52 |
| Orthopedic.Diag | 0 | 1 | FALSE | 2 | No: 5728, Yes: 7 |
| race | 0 | 1 | FALSE | 3 | whi: 4460, bla: 920, oth: 355 |
| income | 0 | 1 | FALSE | 4 | Und: 3226, $11: 1165, $25: 893, > $: 451 |
Variable type: numeric
| skim_variable | n_missing | complete_rate | mean | sd | p0 | p25 | p50 | p75 | p100 | hist |
|---|---|---|---|---|---|---|---|---|---|---|
| edu | 0 | 1 | 11.68 | 3.15 | 0.00 | 10.00 | 12.00 | 13.00 | 30.00 | ▁▇▃▁▁ |
| DASIndex | 0 | 1 | 20.50 | 5.32 | 11.00 | 16.06 | 19.75 | 23.43 | 33.00 | ▃▇▆▂▃ |
| APACHE.score | 0 | 1 | 54.67 | 19.96 | 3.00 | 41.00 | 54.00 | 67.00 | 147.00 | ▂▇▅▁▁ |
| Glasgow.Coma.Score | 0 | 1 | 21.00 | 30.27 | 0.00 | 0.00 | 0.00 | 41.00 | 100.00 | ▇▂▂▁▁ |
| blood.pressure | 0 | 1 | 78.52 | 38.05 | 0.00 | 50.00 | 63.00 | 115.00 | 259.00 | ▆▇▆▁▁ |
| WBC | 0 | 1 | 15.65 | 11.87 | 0.00 | 8.40 | 14.10 | 20.05 | 192.00 | ▇▁▁▁▁ |
| Heart.rate | 0 | 1 | 115.18 | 41.24 | 0.00 | 97.00 | 124.00 | 141.00 | 250.00 | ▁▂▇▂▁ |
| Respiratory.rate | 0 | 1 | 28.09 | 14.08 | 0.00 | 14.00 | 30.00 | 38.00 | 100.00 | ▅▇▂▁▁ |
| Temperature | 0 | 1 | 37.62 | 1.77 | 27.00 | 36.09 | 38.09 | 39.00 | 43.00 | ▁▁▅▇▁ |
| PaO2vs.FIO2 | 0 | 1 | 222.27 | 114.95 | 11.60 | 133.31 | 202.50 | 316.62 | 937.50 | ▇▇▁▁▁ |
| Albumin | 0 | 1 | 3.09 | 0.78 | 0.30 | 2.60 | 3.50 | 3.50 | 29.00 | ▇▁▁▁▁ |
| Hematocrit | 0 | 1 | 31.87 | 8.36 | 2.00 | 26.10 | 30.00 | 36.30 | 66.19 | ▁▆▇▃▁ |
| Bilirubin | 0 | 1 | 2.27 | 4.80 | 0.10 | 0.80 | 1.01 | 1.40 | 58.20 | ▇▁▁▁▁ |
| Creatinine | 0 | 1 | 2.13 | 2.05 | 0.10 | 1.00 | 1.50 | 2.40 | 25.10 | ▇▁▁▁▁ |
| Sodium | 0 | 1 | 136.77 | 7.66 | 101.00 | 132.00 | 136.00 | 142.00 | 178.00 | ▁▂▇▁▁ |
| Potassium | 0 | 1 | 4.07 | 1.03 | 1.10 | 3.40 | 3.80 | 4.60 | 11.90 | ▂▇▁▁▁ |
| PaCo2 | 0 | 1 | 38.75 | 13.18 | 1.00 | 31.00 | 37.00 | 42.00 | 156.00 | ▃▇▁▁▁ |
| PH | 0 | 1 | 7.39 | 0.11 | 6.58 | 7.34 | 7.40 | 7.46 | 7.77 | ▁▁▂▇▁ |
| Weight | 0 | 1 | 67.83 | 29.06 | 0.00 | 56.30 | 70.00 | 83.70 | 244.00 | ▂▇▁▁▁ |
| Length.of.Stay | 0 | 1 | 21.56 | 25.87 | 2.00 | 7.00 | 14.00 | 25.00 | 394.00 | ▇▁▁▁▁ |
| Death | 0 | 1 | 0.65 | 0.48 | 0.00 | 0.00 | 1.00 | 1.00 | 1.00 | ▅▁▁▁▇ |
| RHC.use | 0 | 1 | 0.38 | 0.49 | 0.00 | 0.00 | 0.00 | 1.00 | 1.00 | ▇▁▁▁▅ |
corrplot
The corrplot package is useful for visualizing correlation matrices with different styles (circle, color, etc.), making correlations easier to interpret.
# Step 1: Select only numerical variables from ObsData
ObsData_num <- dplyr::select(ObsData, where(is.numeric))

# Step 2: Compute the correlation matrix
corr_matrix <- cor(ObsData_num, use = "complete.obs")

# Step 3: Plot the correlation matrix using corrplot
corrplot::corrplot(corr_matrix, method = "circle")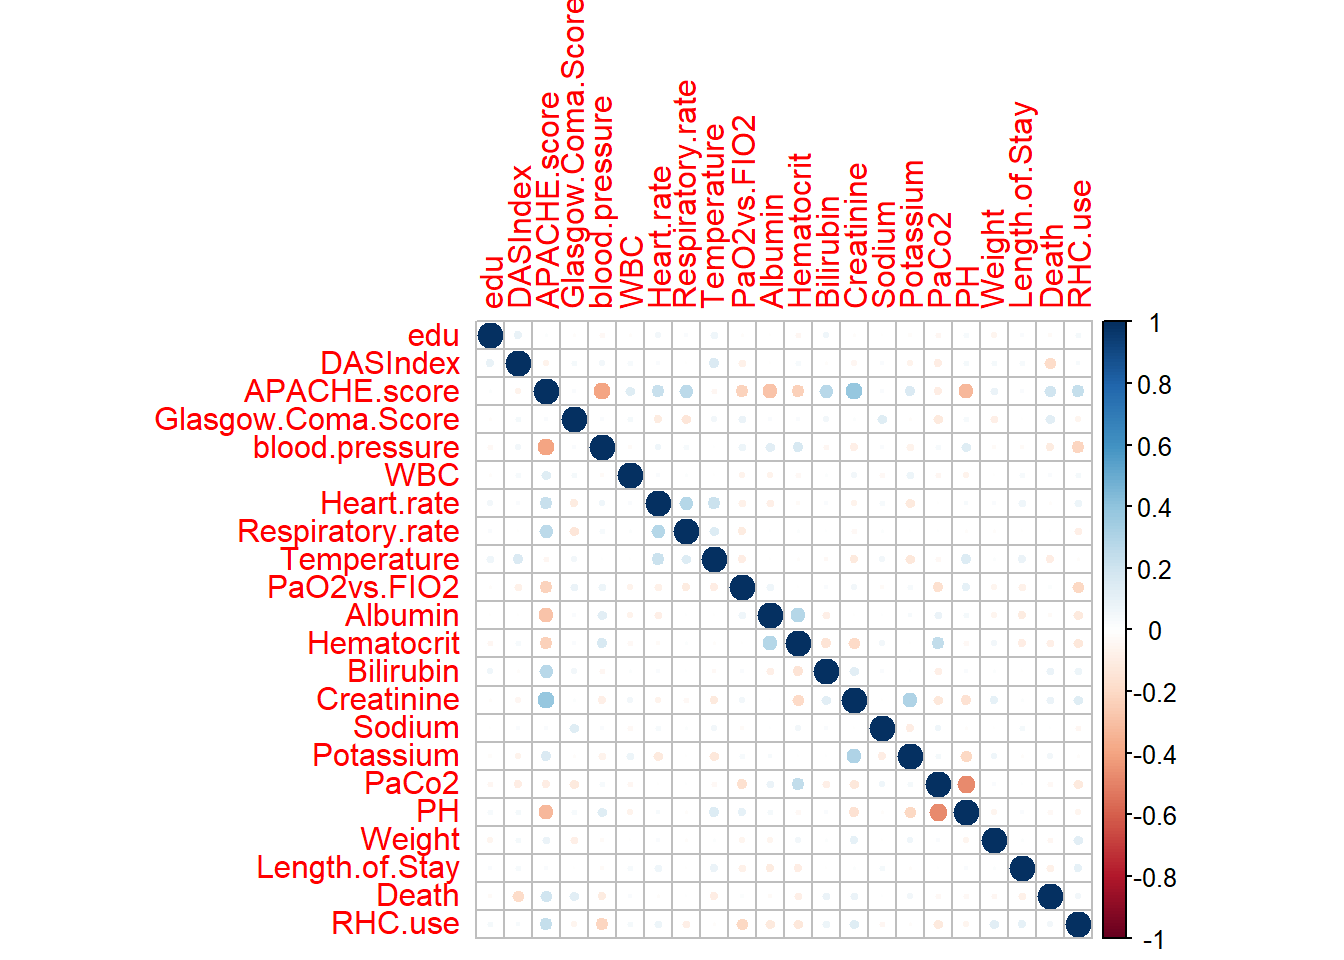
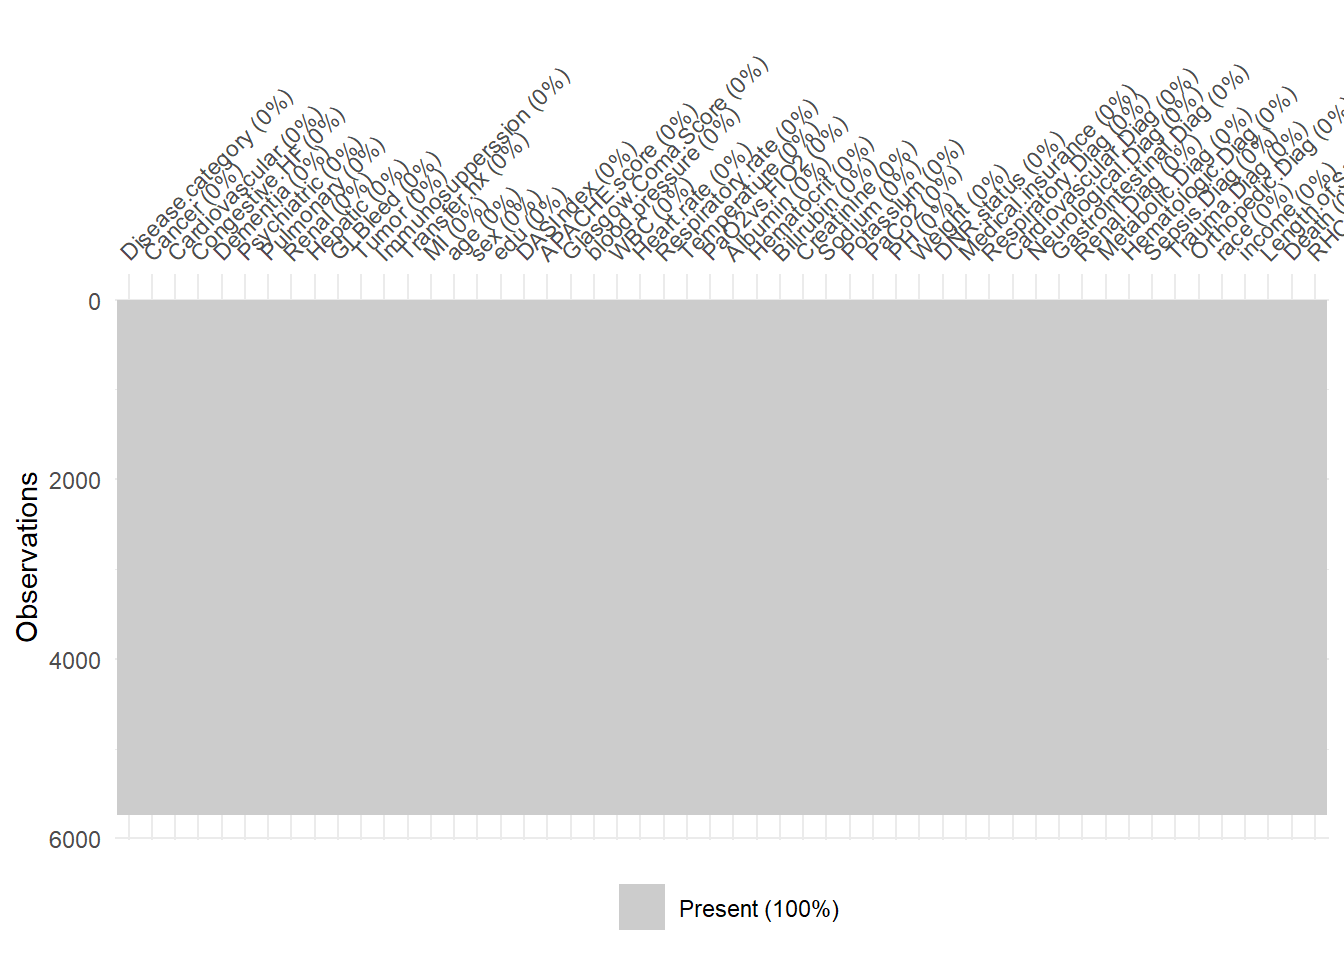
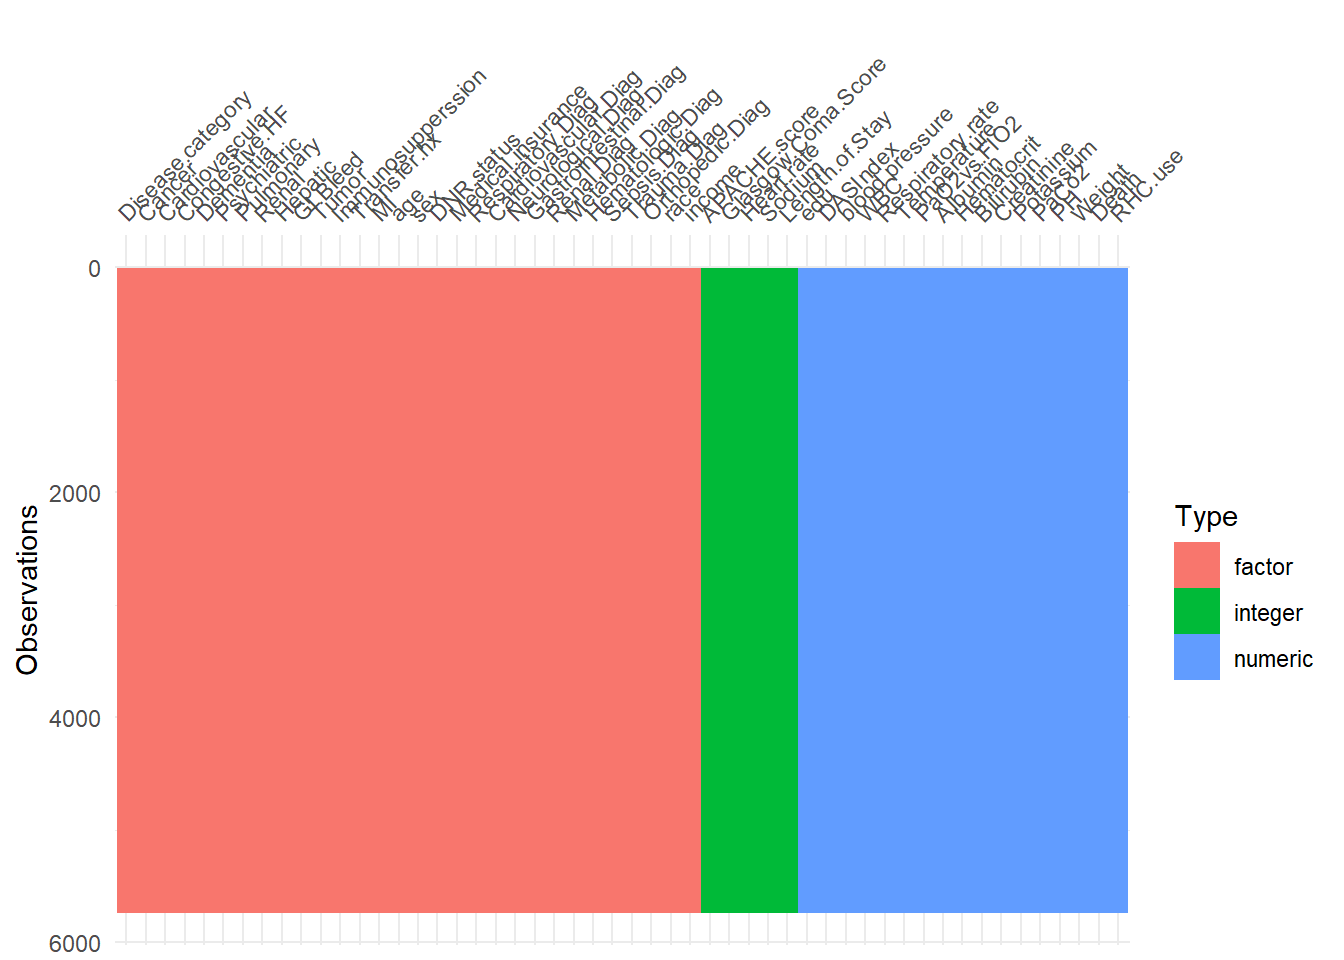
visdat
The visdat package helps visualize missing data patterns, data types, and distributions.
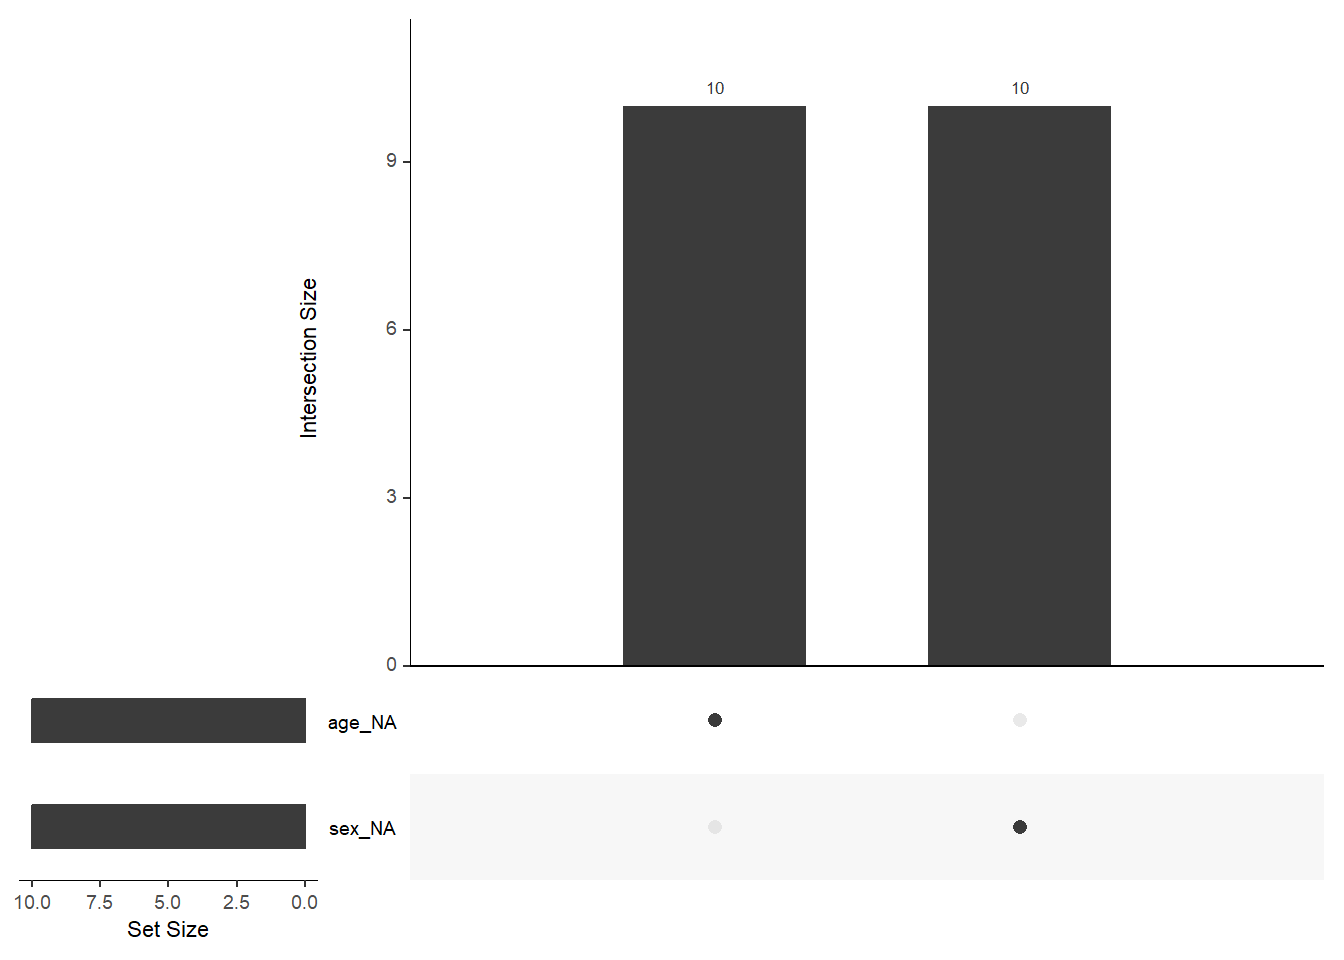
naniar
The naniar package provides tools to handle and visualize missing data, helping to explore missingness patterns in the data.
# Introduce some missing values for demonstration
ObsData_with_NA <- ObsData
ObsData_with_NA$age[sample(1:nrow(ObsData), 10)] <- NA
ObsData_with_NA$sex[sample(1:nrow(ObsData), 10)] <- NA

# Visualize missing data across variables
gg_miss_var(ObsData_with_NA)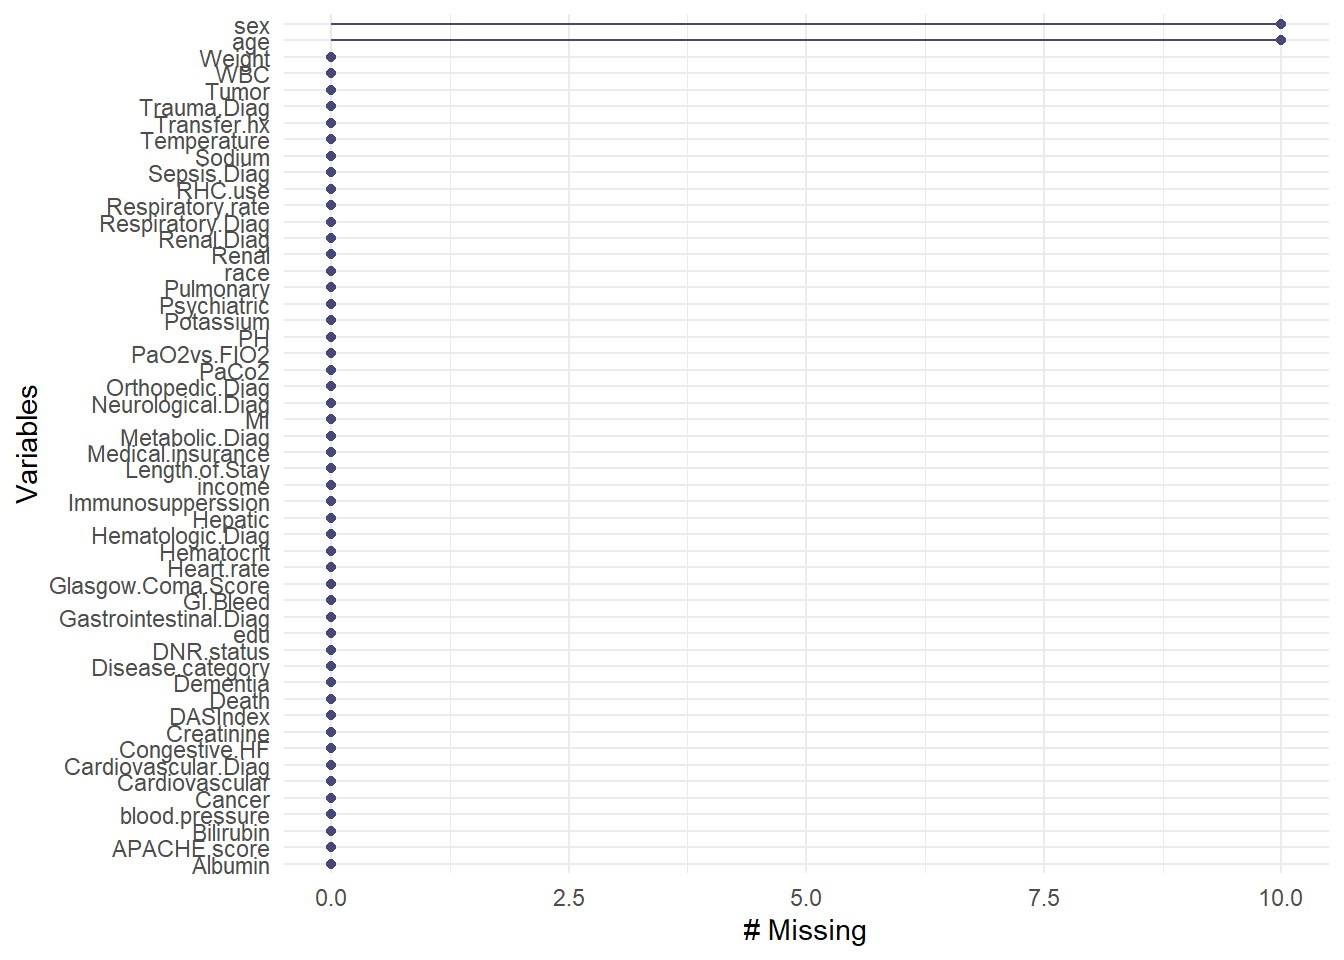
# Plot the missing data upset plot
naniar::gg_miss_upset(ObsData_with_NA)
#> Warning: Using `size` aesthetic for lines was deprecated in ggplot2 3.4.0.
#> ℹ Please use `linewidth` instead.
#> ℹ The deprecated feature was likely used in the UpSetR package.
#>   Please report the issue to the authors.
#> `geom_line()`: Each group consists of only one observation.
#> ℹ Do you need to adjust the group aesthetic?
#> Warning: The `size` argument of `element_line()` is deprecated as of ggplot2 3.4.0.
#> ℹ Please use the `linewidth` argument instead.
#> ℹ The deprecated feature was likely used in the UpSetR package.
#>   Please report the issue to the authors.