library(tidyverse)  # AI-EDIT(2026-06-23): tidyverse-default — consolidated core library() calls into library(tidyverse)
library(knitr)

candidate_paths <- c(
  "examples/nhanes-equity/data/nhanes_equity_v6.csv",
  "../../examples/nhanes-equity/data/nhanes_equity_v6.csv"
)

data_path <- candidate_paths[file.exists(candidate_paths)][1]
if (is.na(data_path)) {
  stop("Could not find examples/nhanes-equity/data/nhanes_equity_v6.csv")
}

nhanes <- read_csv(data_path, show_col_types = FALSE)Report Template: NHANES Equity Summary
Standalone YAML
If you copy this template into a project report outside the book, start the file with this YAML header:
Purpose
This runnable template shows how to pair a dashboard with a short reproducible report. The dashboard supports exploration; the report fixes one question, documents the data, and cites the source.
Question
How does mean BMI vary by income group among adults age 20-80 in the prepared NHANES Health Equity classroom dataset?
Data Source
The report uses the cached CSV snapshot at examples/nhanes-equity/data/nhanes_equity_v6.csv. The source data are derived from CDC/NCHS NHANES public-use files (Centers for Disease Control and Prevention, National Center for Health Statistics 2026).
Methods
We restricted the classroom dataset to adults age 20-80 and summarized BMI by income group. The summaries are unweighted and descriptive. They should not be interpreted as causal effects or national population estimates.
| rows | missing_bmi | missing_income | missing_age |
|---|---|---|---|
| 57137 | 1009 | 5395 | 0 |
Results
income_summary <- analysis_df |>
  filter(!is.na(BMI), !is.na(IncomeGroup)) |>
  group_by(IncomeGroup) |>
  summarise(
    n = n(),
    mean_bmi = mean(BMI),
    sd_bmi = sd(BMI),
    .groups = "drop"
  ) |>
  mutate(
    `BMI, mean (SD)` = sprintf("%.1f (%.1f)", mean_bmi, sd_bmi)
  ) |>
  select(IncomeGroup, n, `BMI, mean (SD)`)

kable(income_summary, caption = "Descriptive BMI summary by income group.")| IncomeGroup | n | BMI, mean (SD) |
|---|---|---|
| High Income (>3.5) | 16330 | 28.6 (6.3) |
| Low Income (<1.3) | 15293 | 29.4 (7.5) |
| Middle Income | 19228 | 29.3 (7.0) |
plot_df <- analysis_df |>
  filter(!is.na(BMI), !is.na(IncomeGroup)) |>
  group_by(IncomeGroup) |>
  summarise(
    n = n(),
    mean_bmi = mean(BMI),
    .groups = "drop"
  )

ggplot(plot_df, aes(x = IncomeGroup, y = mean_bmi)) +
  geom_col(fill = "#2C7FB8") +
  geom_text(aes(label = paste0("n=", n)), vjust = -0.4, size = 3.5) +
  labs(
    title = "Mean BMI by income group",
    subtitle = "Adults age 20-80; unweighted descriptive summary",
    x = "Income group",
    y = "Mean BMI"
  ) +
  expand_limits(y = 0) +
  theme_minimal(base_size = 12)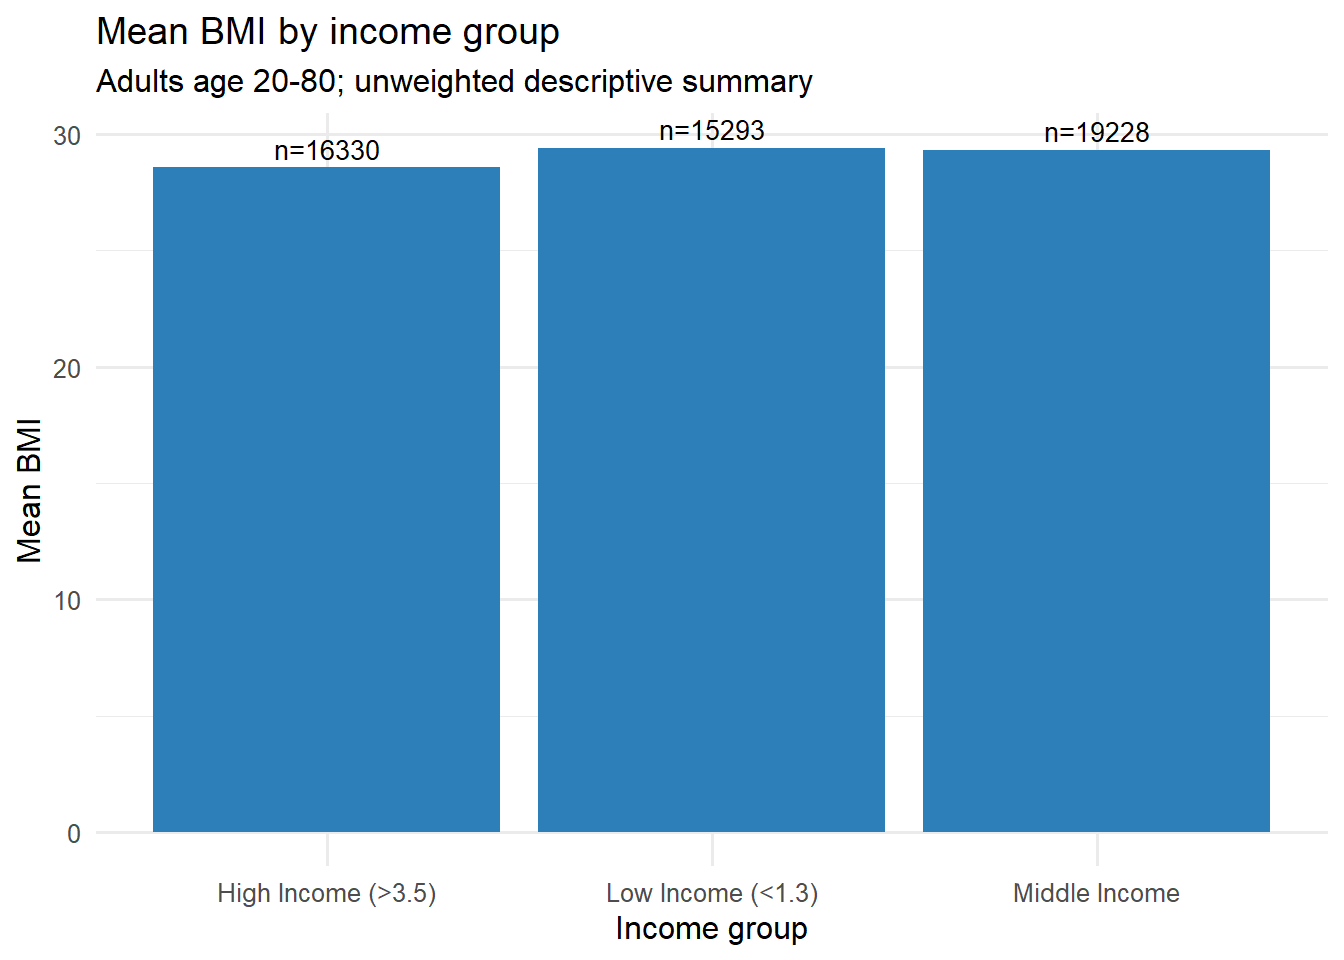
Limitations
- The table and figure use a prepared classroom dataset rather than raw NHANES files.
- The summaries are unweighted.
- The comparison is descriptive and does not establish causality.
- Missing BMI or income group values are excluded from the grouped summary.
Plain-Language Summary
In this classroom dataset, mean BMI differs across income groups. The result is useful for practicing reproducible reporting and dashboard interpretation, but it should be described as a descriptive pattern rather than a causal finding.
AI-Use and Audit Note
Document any AI assistance used to draft code, captions, or interpretation. State exactly which output you checked against the code, data dictionary, or rendered report.
Publishing Checklist
- Report renders from source.
- Citations resolve.
- Figures and tables are generated by code.
- Private preview is used unless the data, repository, and group privacy checks support public sharing.
- Public preview contains no restricted data, private links, credentials, or sensitive row-level examples.
- Staged files were reviewed before committing: no raw row-level data, credentials,
.RDataworkspaces, or stray generated files, and.gitignorecovers the data folder and rendered outputs — see the pre-commit privacy checklist. - Private repository access is granted to course staff when needed.
- Canvas submission includes the repository link, report path, and latest commit hash.
Grounding Audit Prompt
Select three claims from the report. For each claim, write the supporting evidence source: code chunk, table, figure, or citation. Revise any claim that cannot be traced to evidence in the report.
Centers for Disease Control and Prevention, National Center for Health Statistics. 2026. National Health and Nutrition Examination Survey. https://wwwn.cdc.gov/nchs/nhanes/.