| OR | Beta-coef | coef-SE | CI (2.5 %) | CI (97.5 %) | p-value | |
|---|---|---|---|---|---|---|
| Crude (no adjustment) | 2.08 | 0.73 | 0.05 | 0.63 | 0.84 | < 2e-16 |
| PS (no proxies) | 1.98 | 0.68 | 0.07 | 0.61 | 0.76 | < 2e-16 |
| hdPS | 1.52 | 0.42 | 0.04 | 0.35 | 0.49 | < 2e-16 |
| Pure LASSO | 1.34 | 0.29 | 0.05 | 0.19 | 0.39 | 5.9e-08 |
| Hybrid (hdPS, then LASSO) | 1.37 | 0.32 | 0.05 | 0.21 | 0.42 | 3.0e-09 |
| Super learner (GLM, LASSO, MARS) | 1.53 | 0.42 | 0.10 | 0.31 | 0.53 | 2.6e-14 |
| TMLE (GLM, LASSO, MARS in SL) | 1.43 | 0.36 | 0.08 | 0.21 | 0.51 | 4.7e-06 |
| TMLE (only GLM in SL) | 1.46 | 0.38 | 0.08 | 0.23 | 0.53 | 7.7e-07 |
| Kitchen Sink | 1.50 | 0.41 | 0.04 | 0.32 | 0.48 | < 2e-16 |
| Random Forest | 1.54 | 0.43 | 0.04 | 0.35 | 0.51 | < 2e-16 |
| XGBoost | 1.51 | 0.41 | 0.04 | 0.33 | 0.49 | < 2e-16 |
| Forward Selection | 1.56 | 0.44 | 0.04 | 0.36 | 0.52 | < 2e-16 |
| Backward Elimination | 1.53 | 0.43 | 0.04 | 0.34 | 0.50 | < 2e-16 |
18 Compare results
- PS is the result from the propensity score approach that did not include any proxies.
- Results from this approach is somewhat different than other approaches.
- More detailed results from simulations are available elsewhere (Karim 2023).
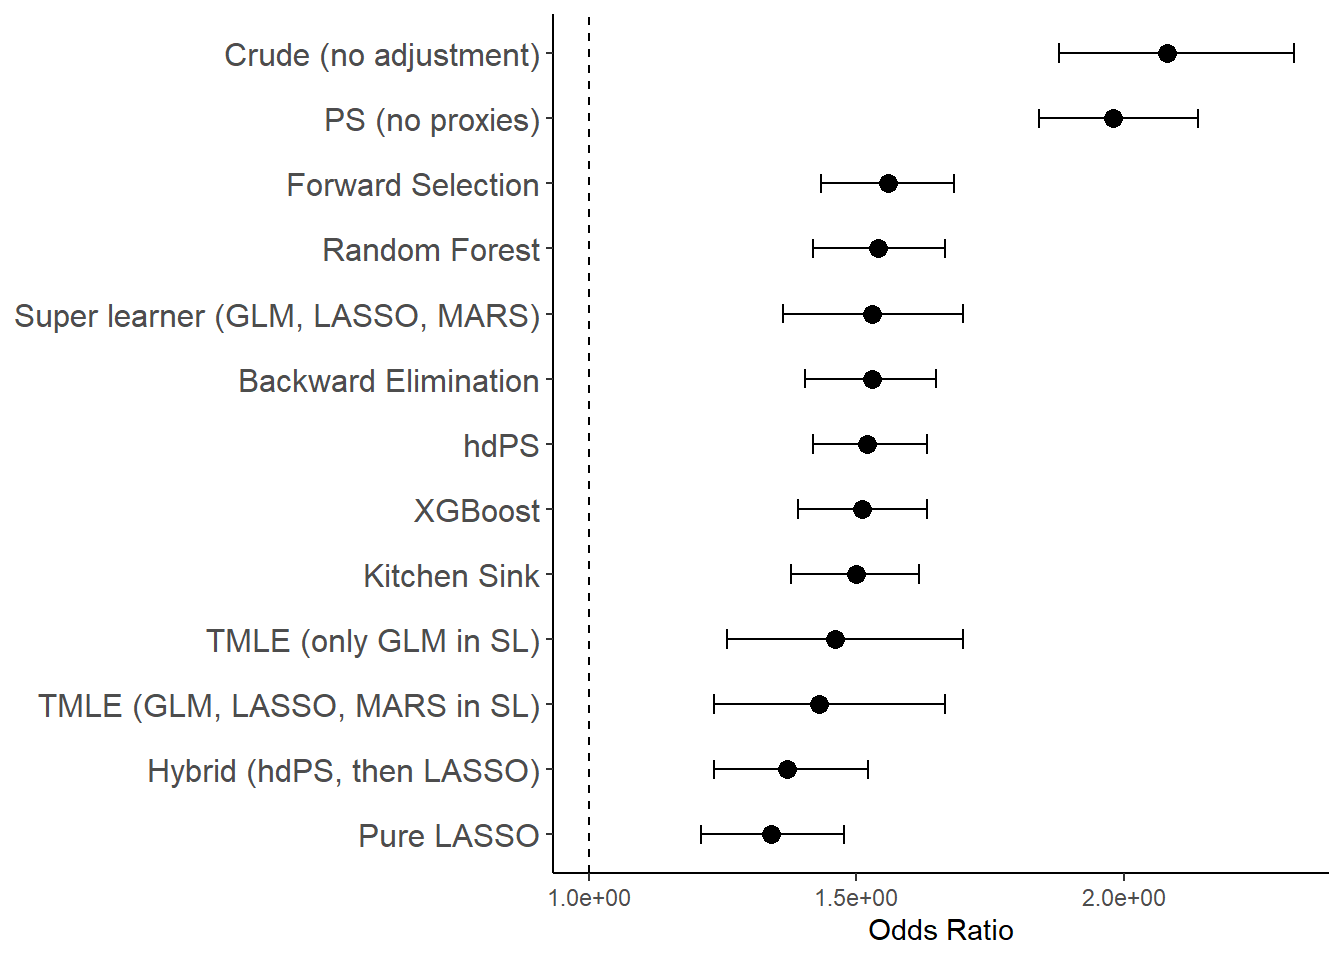
Across all methods evaluated—including hdPS, regularized regression (LASSO, Hybrid), ensemble learners (Super Learner, TMLE), and high-dimensional variable selection strategies (e.g., Kitchen Sink, Random Forest, XGBoost)—adjusted odds ratios ranged from 1.34 to 1.56, with most clustering between 1.50 and 1.56. In contrast, unadjusted and PS-only models produced substantially higher ORs (>1.9).