18 Compare results
| OR | Beta-coef | coef-SE | CI (2.5 %) | CI (97.5 %) | p-value | |
|---|---|---|---|---|---|---|
| Crude (no adjustment) | 2.08 | 0.73 | 0.05 | 0.63 | 0.84 | < 2e-16 |
| PS (no proxies) | 1.98 | 0.68 | 0.04 | 0.61 | 0.76 | < 2e-16 |
| hdPS | 1.52 | 0.42 | 0.04 | 0.35 | 0.49 | < 2e-16 |
| Pure LASSO | 1.51 | 0.41 | 0.04 | 0.34 | 0.49 | < 2e-16 |
| Hybrid (hdPS, then LASSO) | 1.55 | 0.44 | 0.04 | 0.36 | 0.51 | < 2e-16 |
| Super learner (GLM, LASSO, MARS) | 1.60 | 0.47 | 0.04 | 0.39 | 0.54 | < 2e-16 |
| TMLE (GLM, LASSO, MARS in SL) | 1.57 | 0.45 | 0.05 | 0.34 | 0.55 | < 2e-16 |
| TMLE (only GLM in SL) | 1.55 | 0.44 | 0.06 | 0.33 | 0.55 | 2.7e-15 |
- PS is the result from the propensity score approach that did not include any proxies.
- Results from this approach is somewhat different than other approaches.
- More detailed results from simulations are available elsewhere (Karim 2023).
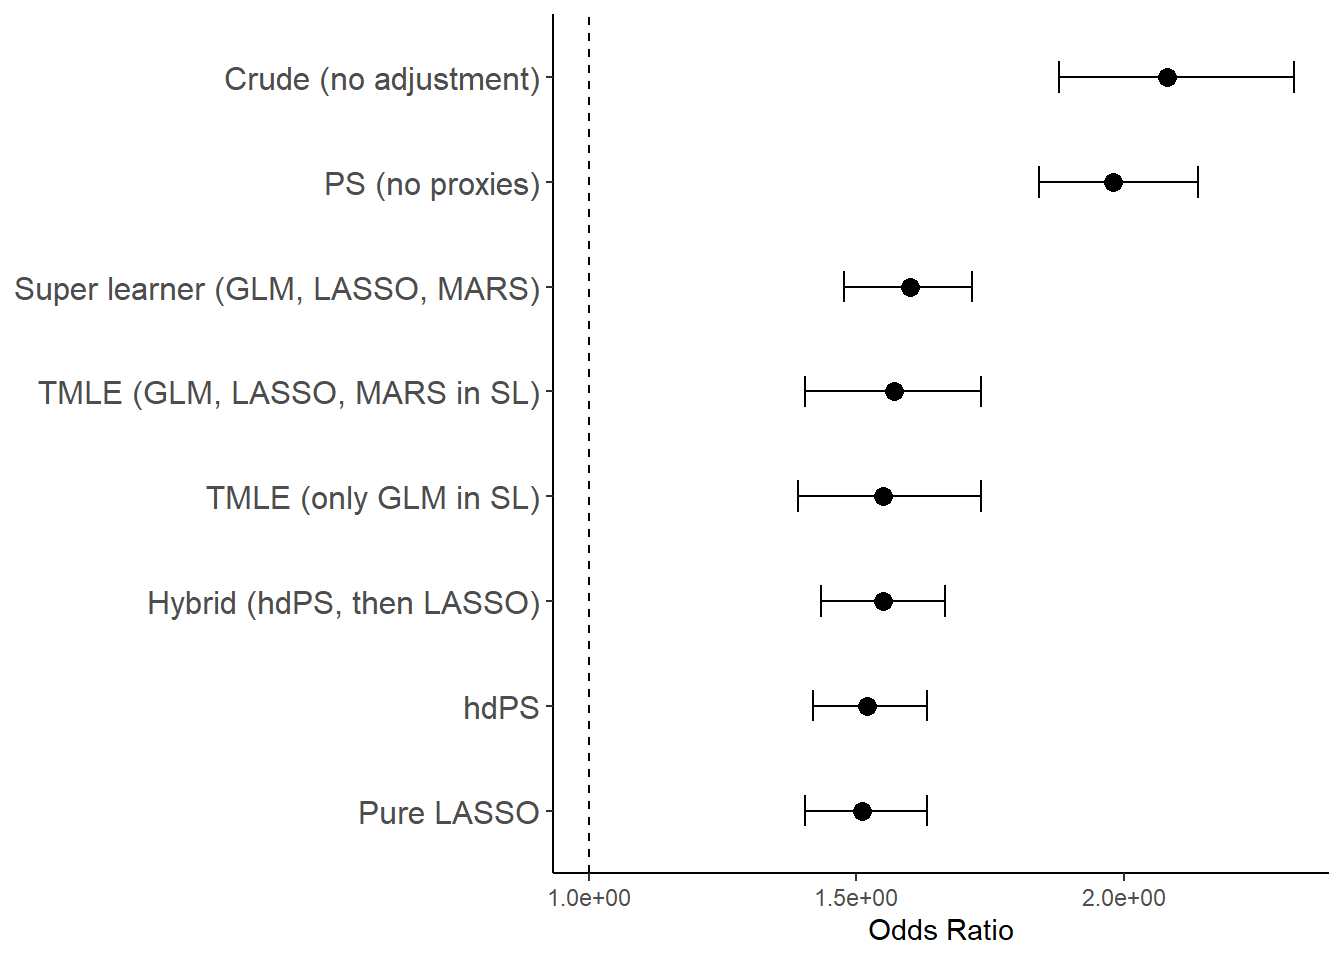
Most hdPS, ML extensions (pure, SL or TMLE) and hybrids perform similarly (ORs between 1.52-1.6)