
1 Data to Analyze
To answer the research question “Does obesity increase the risk of developing diabetes?” in the U.S. context, we do the following:
1.1 Choose a U.S. data source
- Data source: National Health and Nutrition Examination Survey (NHANES) (Disease Control and Prevention 2021)
- Availability: NHANES is a publicly available dataset that can be downloaded for free from the CDC website.
- Design: Observational cross-sectional data. Hence, inferring causality is not a possibility or our objective here.
1.2 Confounder identification
Directed acyclic graph (DAG)
flowchart TB
  A[Obesity A] --> Y(Diabetes Y)
  L[Confounders C] --> Y
  L --> A
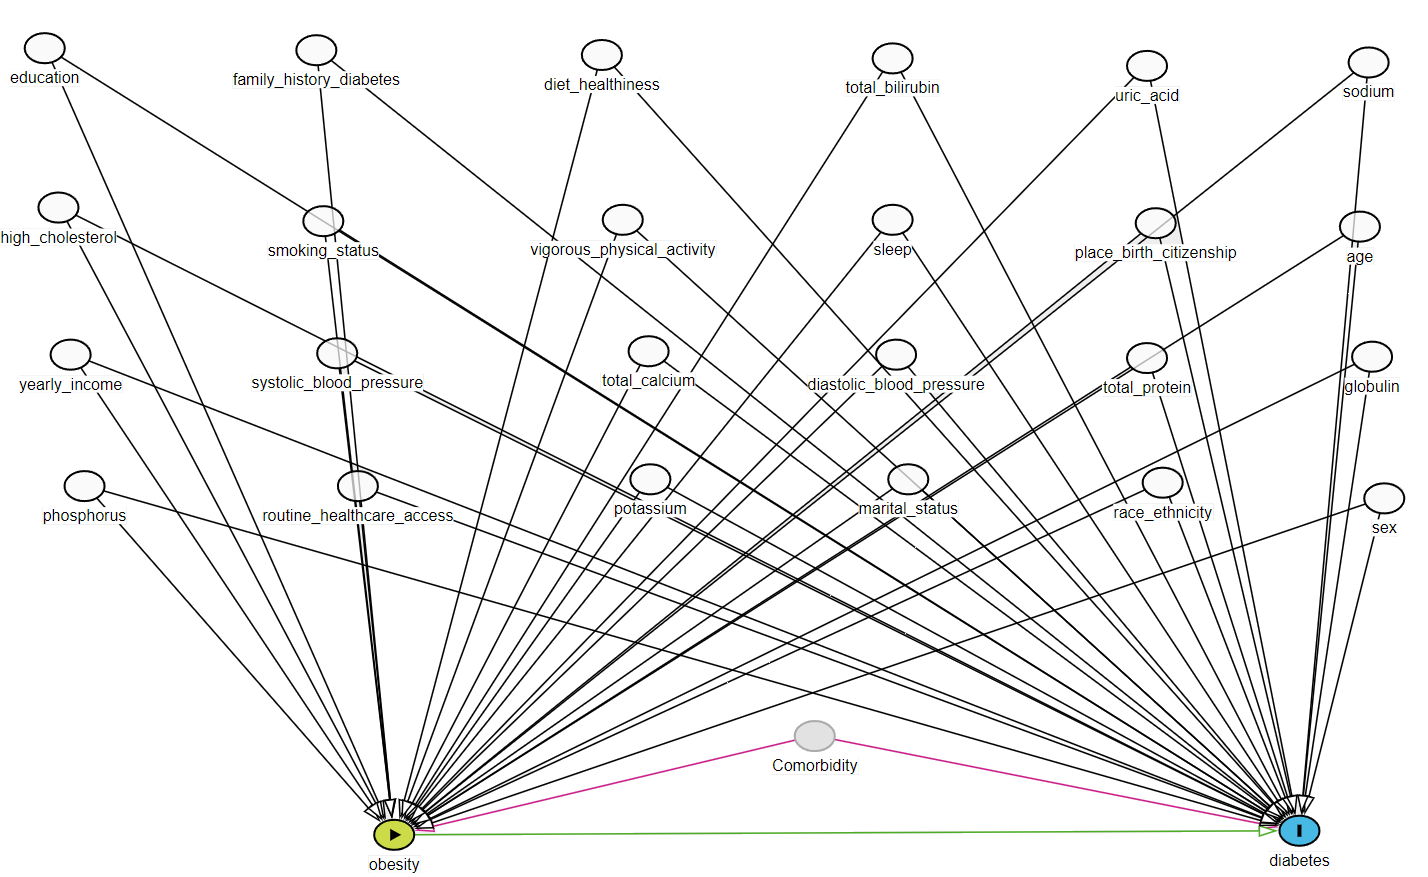
Exposure: Being obese
Outcome: Developing diabetes
Confounders: Demographic and lab variables
1.3 Structure of the data
flowchart LR
  D[NHANES 2013-14] --> demo[Demographic \nVariables \nand \nSample \nWeights]
  demo --> Age
  demo --> Sex
  demo --> Education
  demo --> r[Race or \nethnicity]
  demo --> m[Marital \nstatus]
  demo --> Income
  demo --> b[Birth place]
  demo --> sf[Survey \nfeatures: \nsampling \nweights, \nstrata, \ncluster]
  D --> bmi[Body \nMeasures]
  bmi --> Obesity
  D --> diq[Diabetes]
  diq --> Diabetes
  diq --> f[Family \nhistory of \ndiabetes]
  D --> smq[Smoking - \nCigarette Use]
  smq --> Smoking
  D --> dbq[Diet \nBehavior & \nNutrition]
  dbq --> Diet
  D --> paq[Physical \nActivity]
  paq --> p[Physical \nactivities]
  D --> huq[Hospital \nUtilization & \nAccess \nto Care]
  huq --> mm[Medical \naccess]
  D --> bpx[Blood \nPressure]
  bpx --> sbp[Systolic \nBlood \nPressure]
  bpx --> dbp[Diastolic \nBlood \nPressure]
  D --> bpq[Blood \nPressure & \nCholesterol]
  bpq --> hc[High \ncholesterol]
  D --> slq[Sleep \nDisorders]
  slq --> Sleep
  D --> biopro[Standard\n Biochemistry \nProfile]
  biopro --> u[Uric \nacid]
  biopro --> Protein
  biopro --> Bilirubin
  biopro --> Phosphorus
  biopro --> Sodium
  biopro --> Potassium
  biopro --> Globulin
  biopro --> Calcium
  D --> rxq[Prescription\n Medications -  \nICD-10-CM \ncodes]
  style D fill:#FFA500;
  style rxq fill:#00FF00;
  style biopro fill:#00FF00;
  style slq fill:#00FF00;
  style bpq fill:#00FF00;
  style bpx fill:#00FF00;
  style huq fill:#00FF00;
  style paq fill:#00FF00;
  style dbq fill:#00FF00;
  style smq fill:#00FF00;
  style diq fill:#00FF00;
  style bmi fill:#00FF00;
  style demo fill:#00FF00;
We do the same for the following cycles:
- NHANES 2015-16
- NHANES 2017-18
1.4 Identify measured and unmeasured variables in the data
Find variables capturing the following concepts in the data based on a hypothesized DAG.
| Role | Data Component | Variables considered based on DAG |
|---|---|---|
| Outcome | DIQ | Have diabetes1 |
| Exposure | BMX | Obese; BMI >= 30 |
| Confounder | (demographic) DEMO | Age, Sex, Education, Race/ethnicity, Marital status, Annual household income, County of birth, Survey cycle year |
| (behaviour) SMQ, PAQ, SLQ, DBQ | Smoking2, Vigorous work activity, Sleep3, Diet4 | |
| (health history / access) DIQ, HUQ | Diabetes family history, Access to care5 | |
| (lab) BPX, BPQ, BIOPRO | Blood pressure (systolic, diastolic6), Cholesterol, Uric acid, Total Protein, Total Bilirubin, Phosphorus, Sodium, Potassium, Globulin, Total Calcium |
- 14 demographic, behavioral, health history related variables
- Mostly categorical
- 11 lab variables
- Mostly continuous