1 Data to Analyze
To answer the research question “Does obesity increase the risk of developing diabetes?” in the U.S. context, we do the following:
1.1 Choose a U.S. data source
- Data source: National Health and Nutrition Examination Survey (NHANES) (Disease Control and Prevention 2021)
- Availability: NHANES is a publicly available dataset that can be downloaded for free from the CDC website.
- Design: Observational cross-sectional data.
1.2 Confounder identification
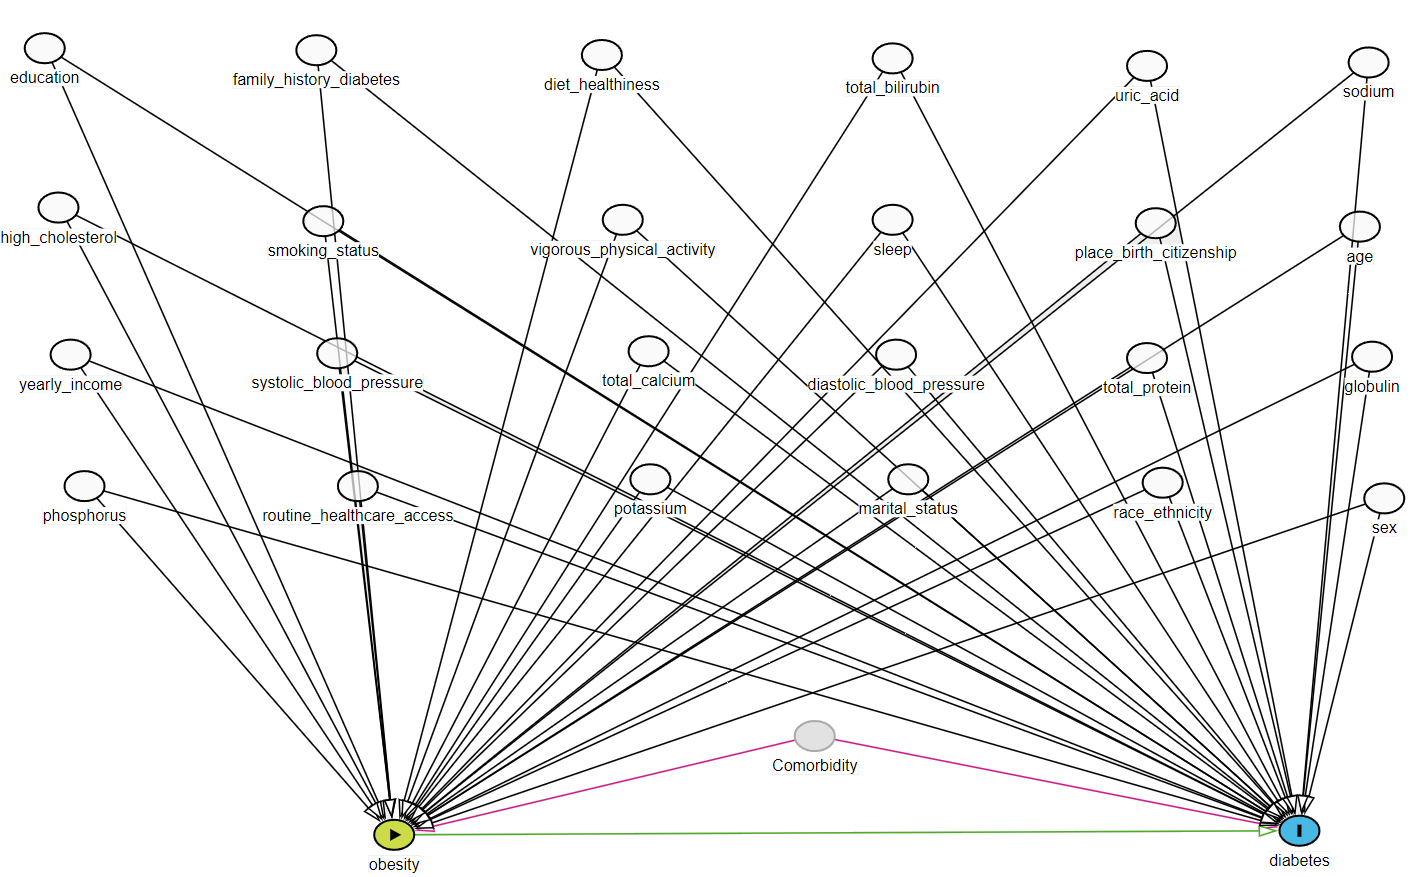
Directed acyclic graph (DAG)
flowchart TB
  A[Obesity A] --> Y(Diabetes Y)
  L[Confounders C] --> Y
  L --> A

Exposure: Being obese
Outcome: Developing diabetes
Confounders: Demographic and lab variables
1.3 Identify measured and unmeasured variables in the data
Find variables capturing the following concepts in the data based on a hypothesized DAG.
| Role | Data Component | Variables considered based on DAG |
|---|---|---|
| Outcome | DIQ | Have diabetes1 |
| Exposure | BMX | Obese; BMI >= 30 |
| Confounder | (demographic) DEMO | Age, Sex, Education, Race/ethnicity, Marital status, Annual household income, County of birth, Survey cycle year |
| (behaviour) SMQ, PAQ, SLQ, DBQ | Smoking2, Vigorous work activity, Sleep3, Diet4 | |
| (health history / access) DIQ, HUQ | Diabetes family history, Access to care5 | |
| (lab) BPX, BPQ, BIOPRO | Blood pressure (systolic, diastolic6), Cholesterol, Uric acid, Total Protein, Total Bilirubin, Phosphorus, Sodium, Potassium, Globulin, Total Calcium |
- 14 demographic, behavioral, health history related variables
- Mostly categorical
- 11 lab variables
- Mostly continuous
1.4 Analytic data
3 cycles of NHANES datasets were merged:
flowchart LR
  A[NHANES] --> C1(2013-2014 cycle) --> ss1(10,175 \nparticipants)
  A --> C2(2015-2016 cycle) --> ss2(9,971 \nparticipants)
  A --> C3(2017-2018 cycle) --> ss3(9,254 \nparticipants)
  ss1 --> ss(7,585 \nafter \nimposing \neligibility \ncriteria)
  ss2 --> ss
  ss3 --> ss
  style A fill:#FFA500;
  style C1 fill:#FFA500;
  style C2 fill:#FFA500;
  style C3 fill:#FFA500;
  style ss1 fill:#FFA500;
  style ss2 fill:#FFA500;
  style ss3 fill:#FFA500;
  style ss fill:#FFA500;
Our study population was restricted to the U.S. population who were
- 20 years or older and
- not pregnant at the time of survey data collection, and
- who had available International Classification of Diseases (ICD) codes to ensure we can extract sufficient proxy information for the analysis (discussed next page).