11 Sensitivity
It is unclear how many proxies (k) should be selected to be included in the propensity score model as there is no clear guideline in the literature.
11.1 Sensitivity analysis for k
11.1.1 Create propensity score formula
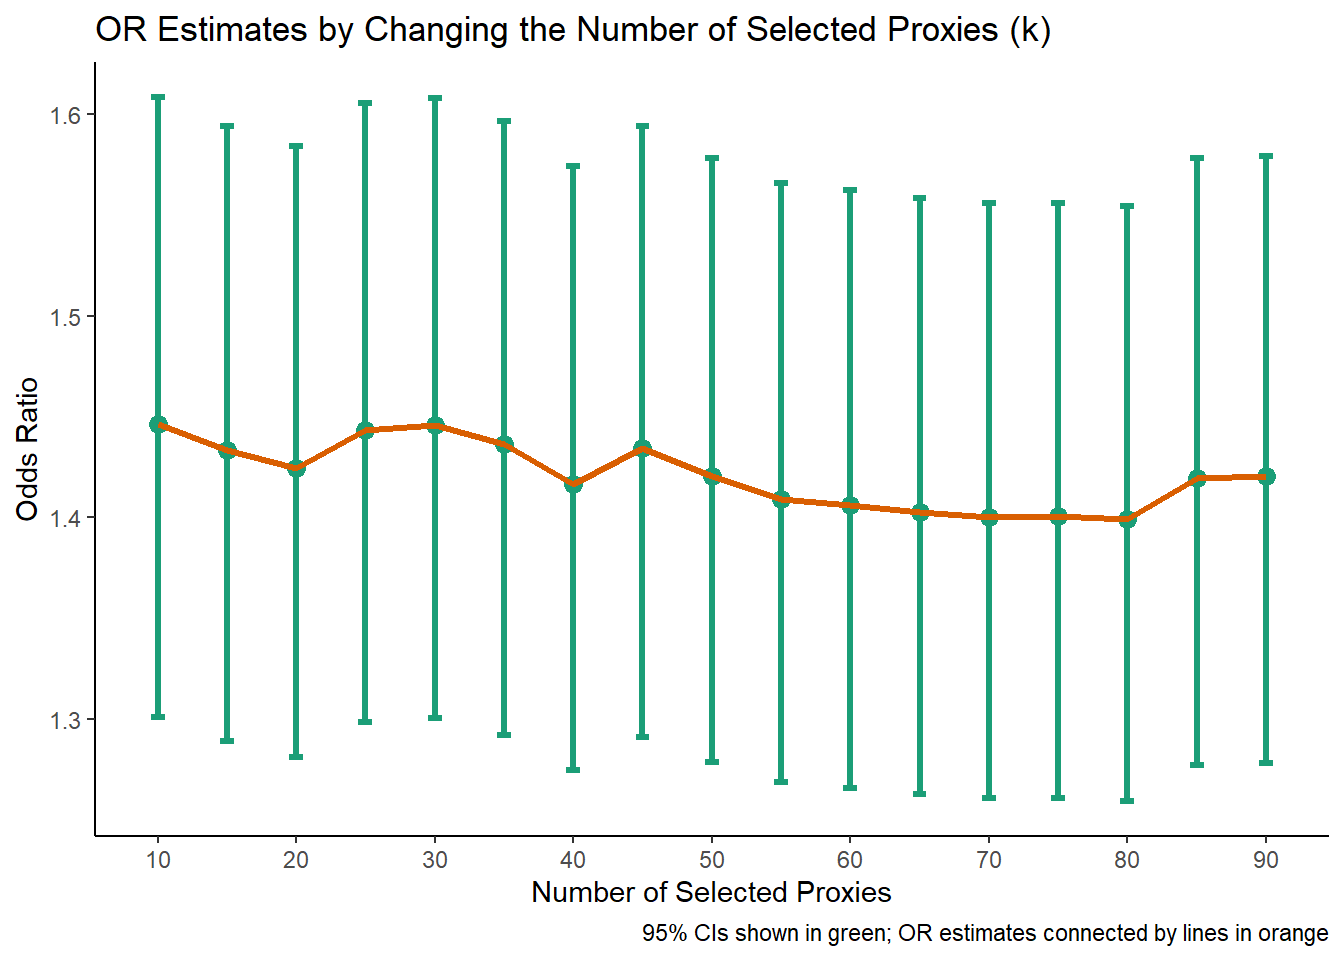
Hence we iterate the process (change k parameter in get_prioritised_covariates function in step 4) and obtain odds ratio (exponentiation of log-OR) for each k. We varied k from 10 to 90.
Find out where OR estimates stabilizes
11.2 Sensitivity analysis for n
We varied n from 10 to 90, remaining everything else constant
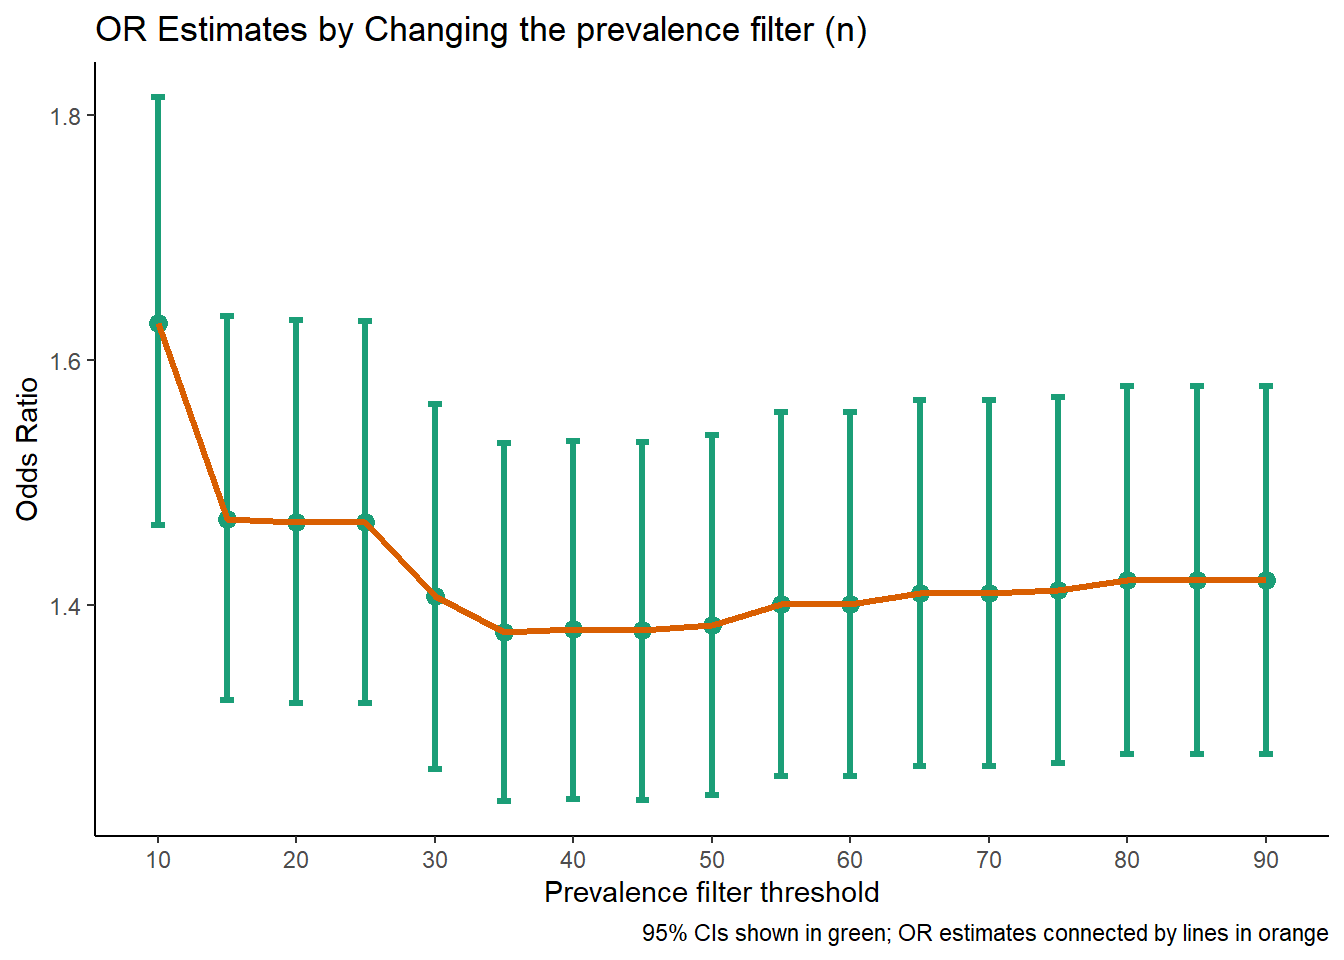
Hence we iterate the process (change n parameter in get_candidate_covariates function step 2) and obtain odds ratio (exponentiation of log-OR) for each n. We varied n from 10 to 90.
Find out where OR estimates stabilize
Literature suggested that this restriction of n can be detrimental (Schuster, Pang, and Platt 2015). Hence in the original analysis we chose n such that that is larger than available empirical covariates.