Section 3 Box 1: Transformation of the continuous outcome variable
min.Y <- min(ObsData$Y)
max.Y <- max(ObsData$Y)
ObsData$Y.bounded <- (ObsData$Y-min.Y)/(max.Y-min.Y)
saveRDS(ObsData, file = "rhcAnalytic.RDS") # for comparisons later
# check the range of our transformed outcome data is what we expect
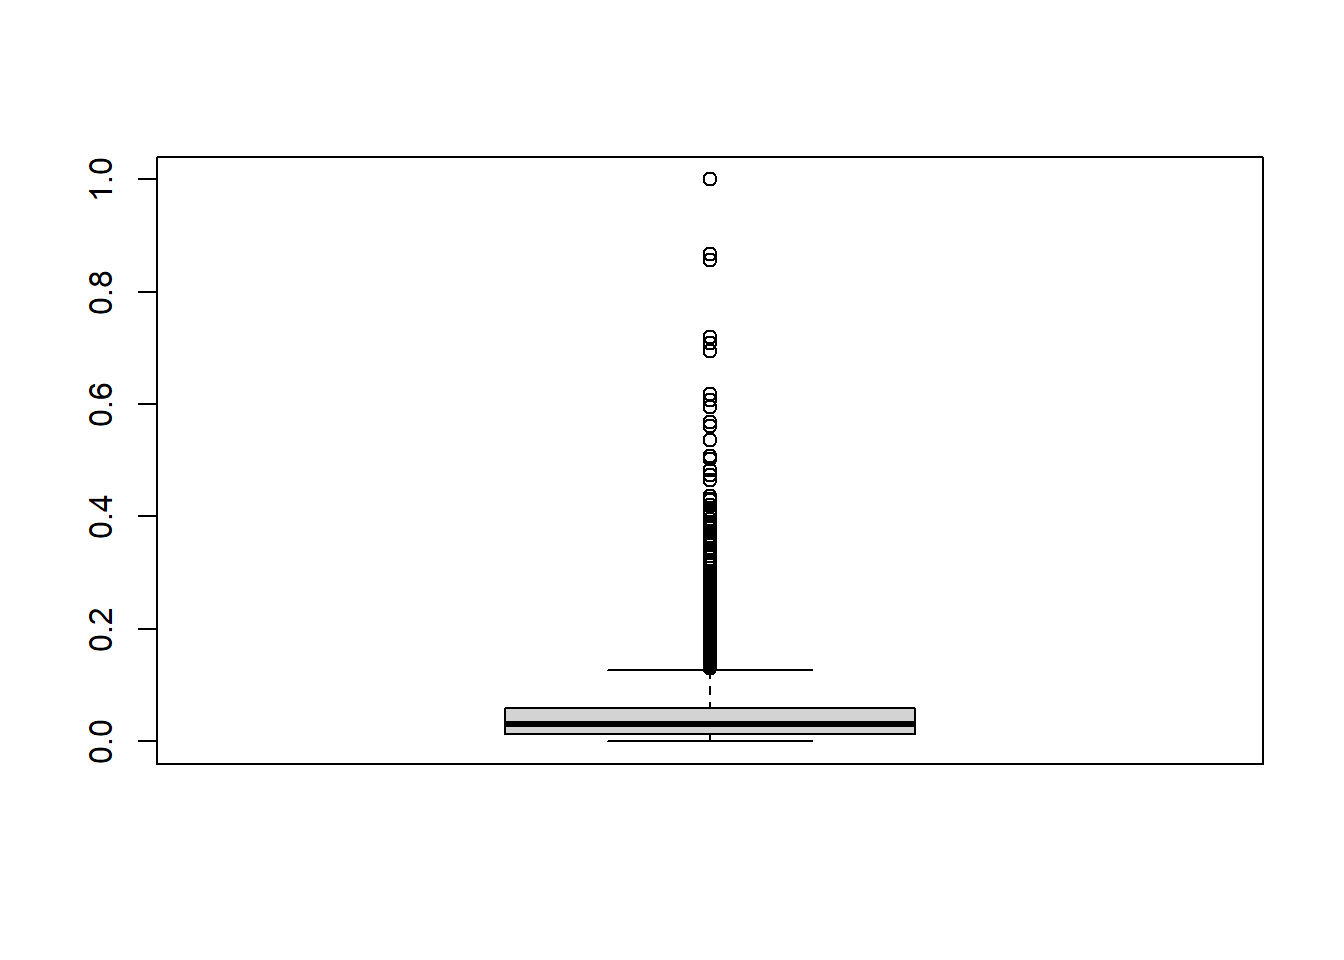
summary(ObsData$Y.bounded)## Min. 1st Qu. Median Mean 3rd Qu. Max.
## 0.00000 0.01276 0.03061 0.04990 0.05867 1.00000boxplot(ObsData$Y.bounded)