Compare Results
Comparing log(OR) from all models (vertical line represents the true parameter for log(OR) when we generated the simulated data):
plot_summs(ITTFit, naivePPFit, BAdjPPFit, SIPWFit,
           scale = TRUE,
           robust = list("HC0","HC0","HC0", "HC0", "HC0"),
           model.names = c("ITT", "PP", "B-PP", "IPW-PP")) +
geom_vline(xintercept = 0.7)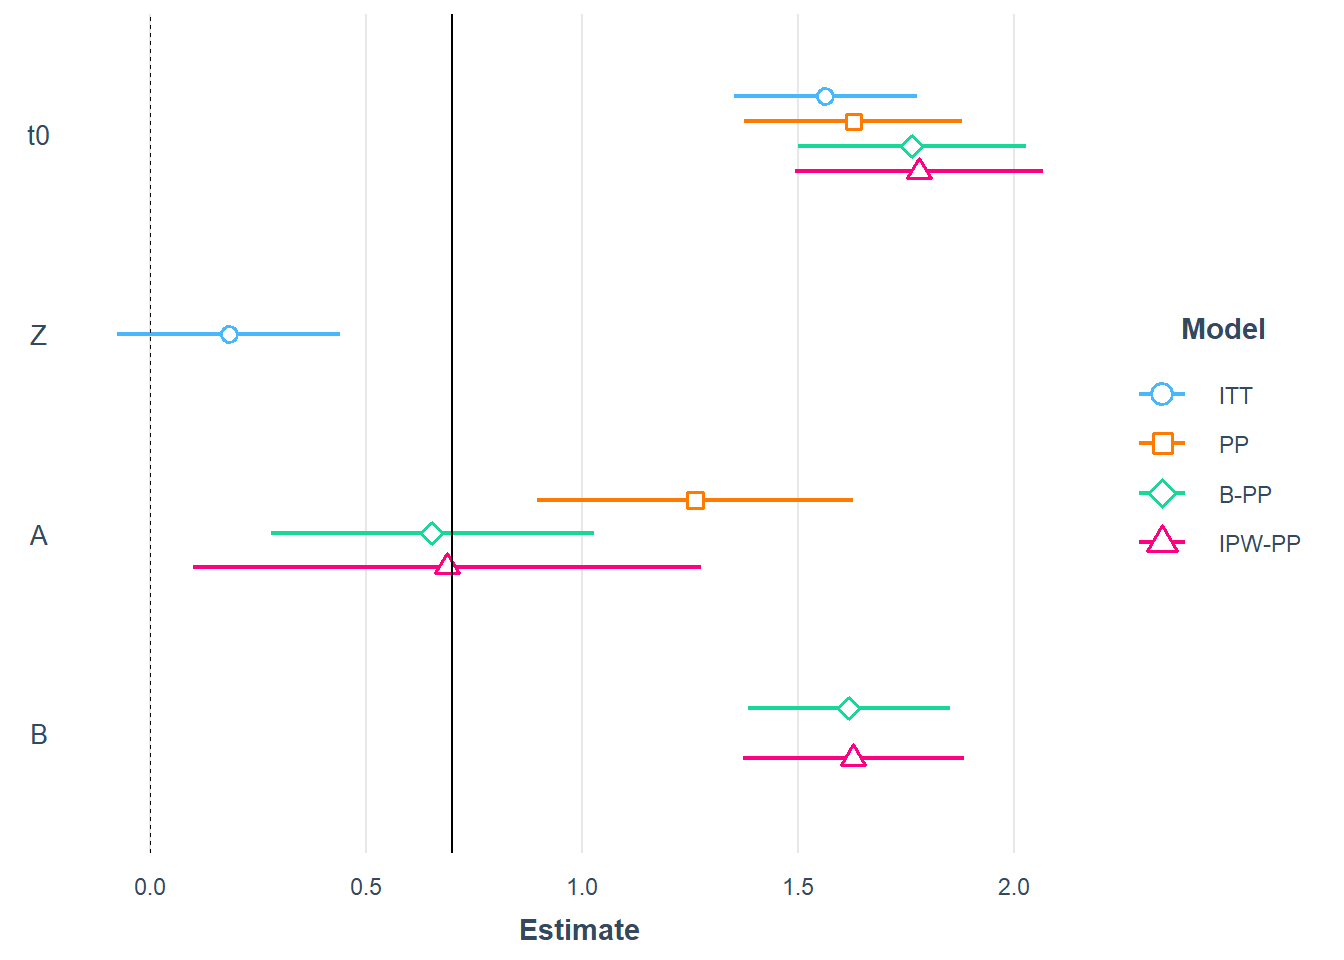
Comparing OR from all models (vertical line represents the true parameter for OR when we generated the simulated data):
plot_summs(ITTFit, naivePPFit, BAdjPPFit, SIPWFit,
           scale = TRUE,
           exp = TRUE,
           robust = list("HC0","HC0","HC0", "HC0", "HC0"),
           model.names = c("ITT", "PP", "B-PP", "IPW-PP")) +
geom_vline(xintercept = exp(0.7))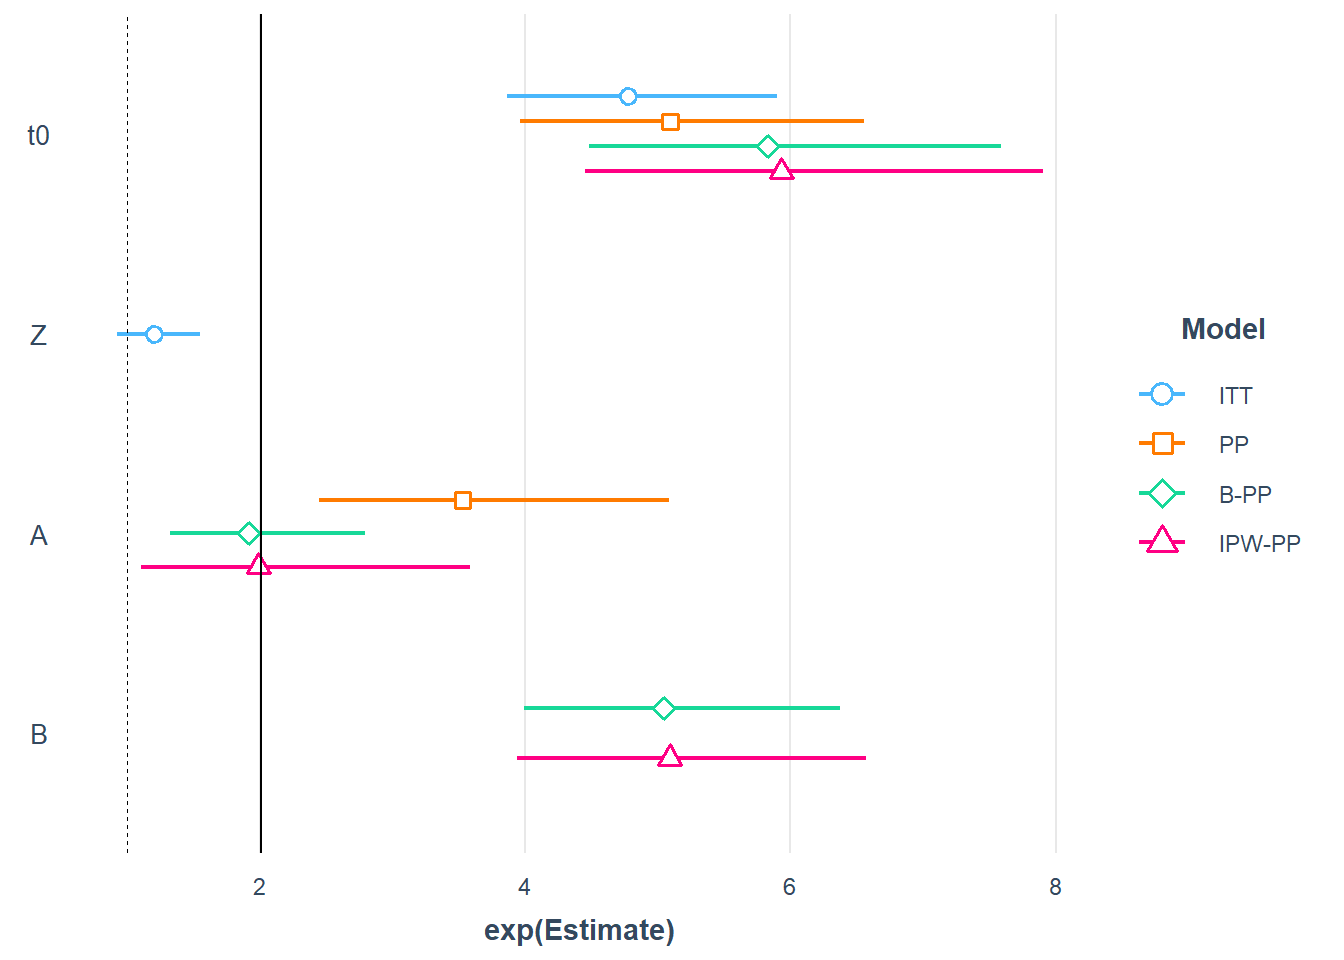
In all of these cases, estimated parameters associated with A are of main interest.